Emissions of NOx occur mainly in the form of NO.
NO and NO2 are rapidly converted into one another and are therefore commonly considered as one pool:
- O3 oxidizes NO to NO2.
- NO2 itself photolyses to NO and O to produce tropospheric ozone.
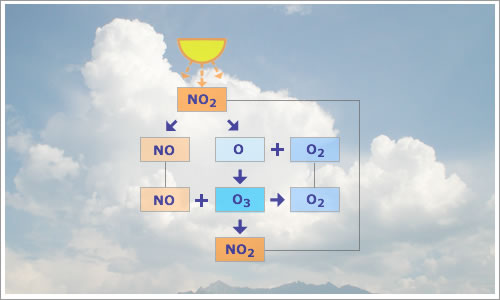
Fig 1.1.3.2.1: Block diagram of the zero NOx catalytic
cycle for O3.
O3 is created and used up within the cycle.
Image: AT2-ELS
| NO2 + hν | → | NO + O (λ < 424 nm) | (1) |
| O + O2 | → | O3 | (2) |
| NO + O3 | → | NO2 + O2 | (3) |
Since the production of one molecule of O3 requires the destruction of one molecule of O3, this cycle has no effect on O3 levels.
The forward and back reactions, (1), (2) and (3), with their dependence on the concentration of NOx and the light intensity, determine the local concentration of ozone. On a sunny summer afternoon the ozone mixing ratio may be between 60 and 80 ppb in the boundary layer.