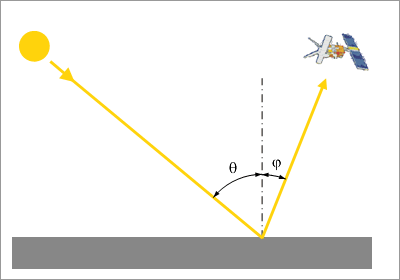
Unfortunately, the tropospheric airmass factor cannot be approximated by the geometric light path, as is the case for the stratospheric airmass factor:

Fig 3.4.3.1.1: Geometric derivation of the airmass factor (AMF)
Image: AT2-ELS
AMFstrat ≈ sec(Θ) + sec(Φ)
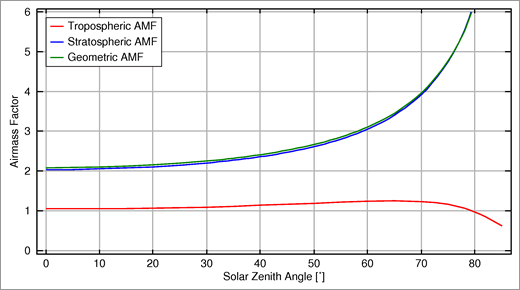
On the contrary, a typical airmass factor for an absorber located in the lowest 2 km of the atmosphere is only weakly dependent on solar zenith angle and the instrument line of sight:

Fig 3.4.3.1.2: Comparison between geometric AM, and tropospheric, stratospheric AMF as calculated with RTM as a function of the Solar Zenith Angle (SZA).
Image: AT2-ELS
The main reason for this is the large impact of scattering in the troposphere, which invalidates the assumption that all photons have the same light path from the sun to the surface and back to the instrument. Depending on the conditions, scattering can have two opposing effects as illustrated in figure xxx:

Fig 3.4.3.1.3: Effects of tropospheric scattering
Image: AT2-ELS
- A reduction in effective light path in the lower part of the atmosphere, because some photons are scattered before they even reach the NO2
- An increase in effective light path in the lower part of the atmosphere, because some photons are scattered several times and 'zigzag' around in the NO2 layer
The first effect dominates over dark surfaces such as water and vegetation, the second over bright areas such as snow or ice. The exact value of the airmass factor depends on several parameters such as the altitude of the absorber and the position of the sun, but also surface reflectivity, aerosol loading and wavelength. Some of these will be discussed in the next sections.
In practice, tropospheric airmass factors are calculated by a radiative transfer program for each measurement using some information from the measurement itself (e.g. geometry), but also information from databases (e.g. surface reflectivity over Europe in April) and atmospheric models (e.g. the typical vertical distribution of NO2 over Brussels in January).