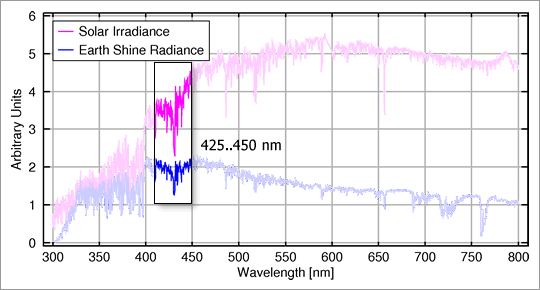
Fig 3.3.1.2.1: Earthshine and solar irradiance spectra 300..800 nm with inset 425..450 nm range.
Image: AT2-ELS
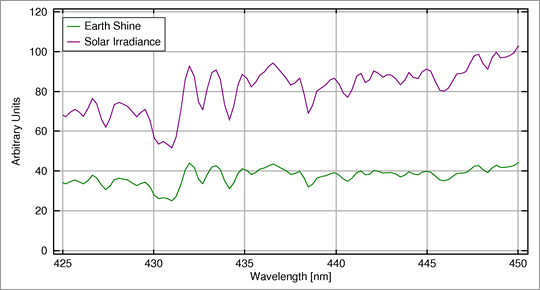
Fig 3.3.1.2.2: Earthshine and solar irradiance spectra 425..450 nm
Image: AT2-ELS
For the purposes of this step-by-step presentation we shall focus on the measured earthshine and solar irradiance spectra between 425 and 450 nm. We have chosen this wavelength range because:
- The reference spectrum for a species can contain certain ranges where absorption changes particularly rapidly with changing wavelength.
- The DOAS technique focuses on the regions of rapidly changing absorption levels.
- In the case of the spectrum of our target substance NO2, the range 425..450 nm shows a large number of rapid changes in absorption.
- In this spectral region there is little interference by other absorbing species.