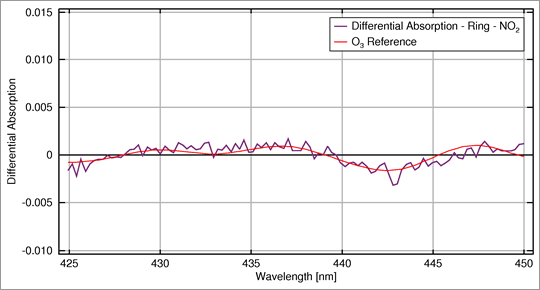
Fig 3.3.1.16.1: O3 reference curve and absorption curve from the NO2 fitting.
Image: AT2-ELS
The reference spectrum for O3 is now fitted to the absorption curve remaining from the previous step.

Fig 3.3.1.16.1: O3 reference curve and absorption curve from the NO2 fitting.
Image: AT2-ELS
The reference spectrum for O3 is now fitted to the absorption curve remaining from the previous step.