Welcome at the LRRT group from IUP-Bremen

The Limb Radiation Retrival Transfer group (LRRT) is based on the Institute of Umweltphysik (IUP), at the University of Bremen, Germany.

The group is led by Dr. Alexei Rozanov

Scientific topics

  • Radiative transfer modelling in UV-Vis-NIR-TIR spectral range, development of the radiative transfer model SCIATRAN
  • Development of the retrieval algorithms for the interpretation of the remote sensing measurements in the UV-Vis-NIR spectral range
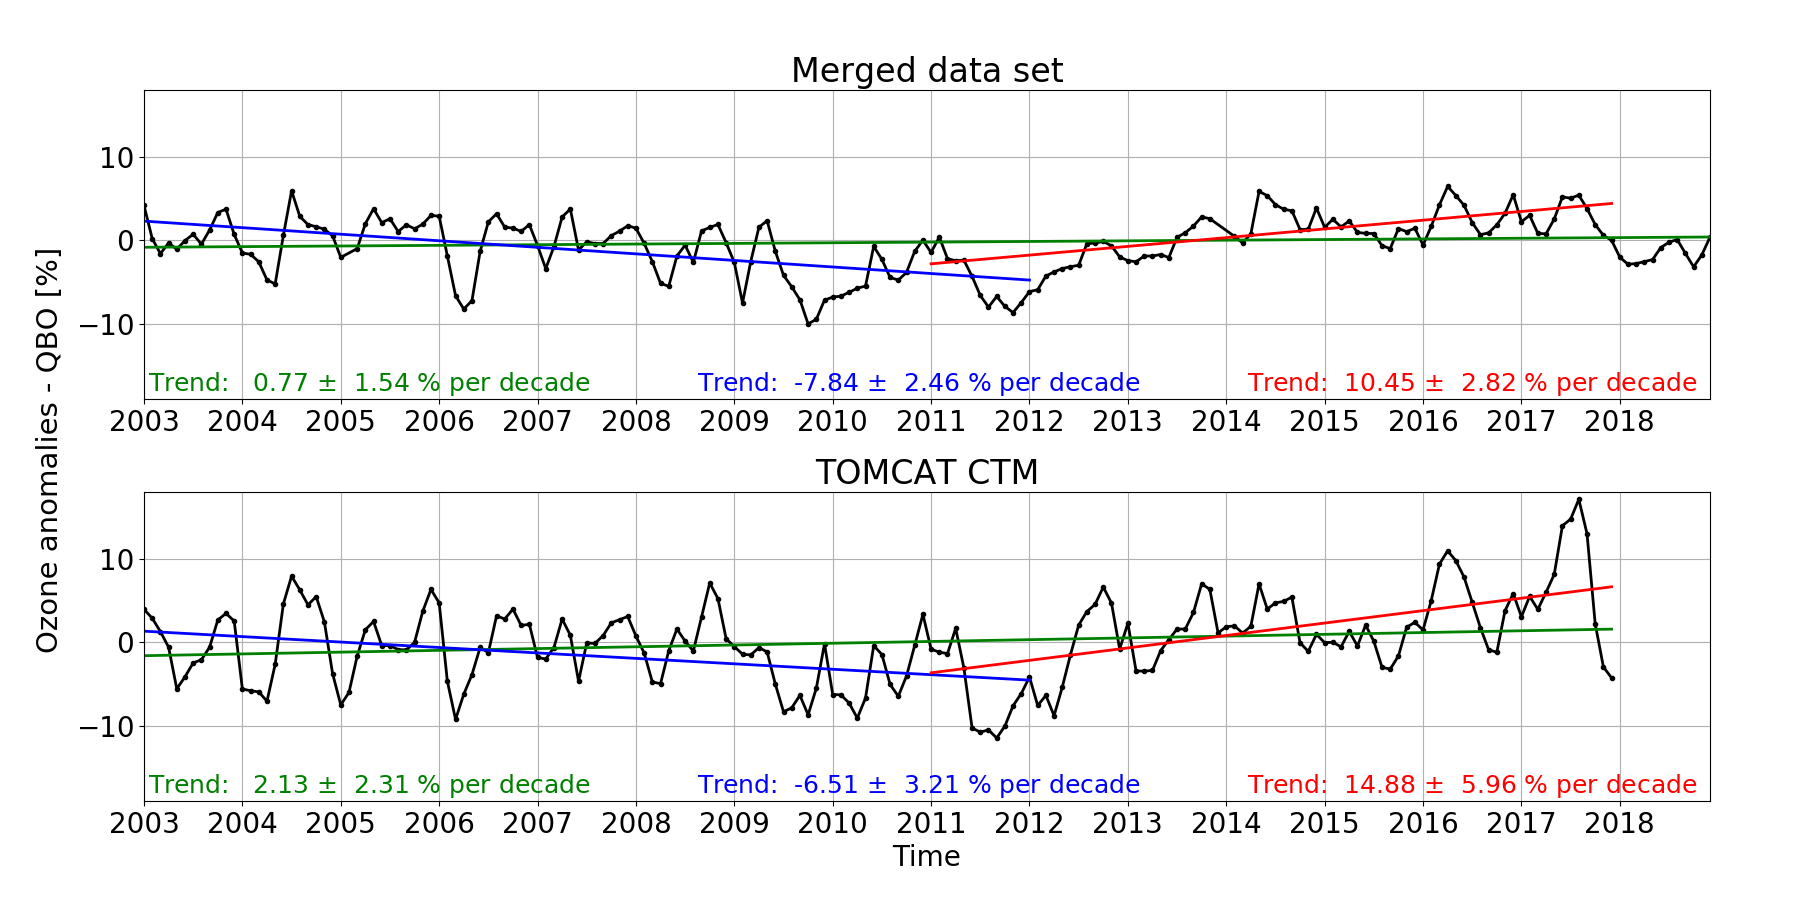
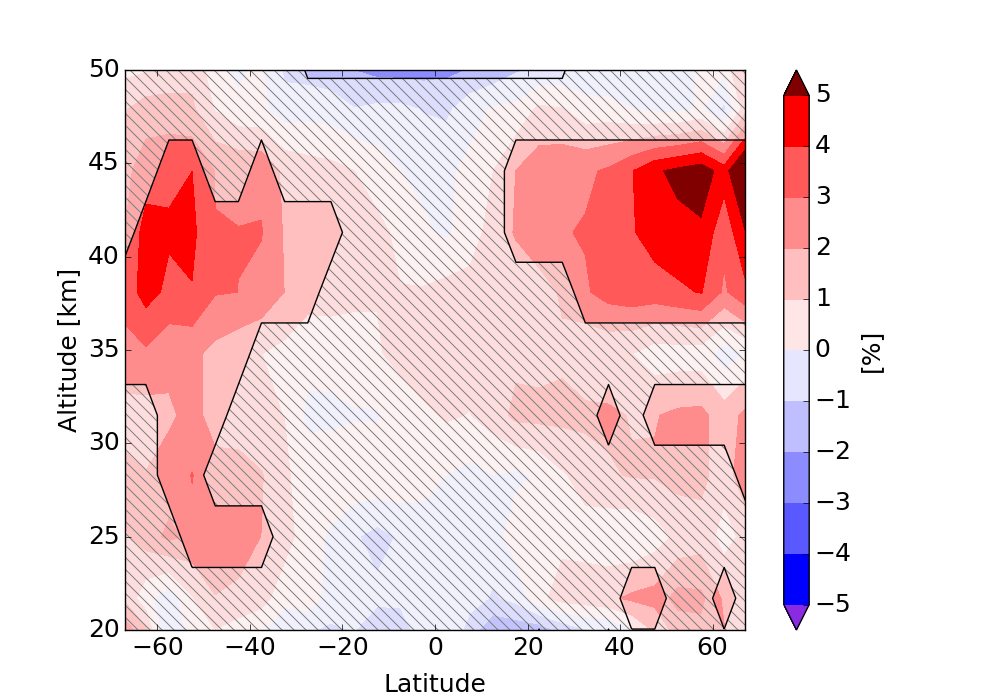
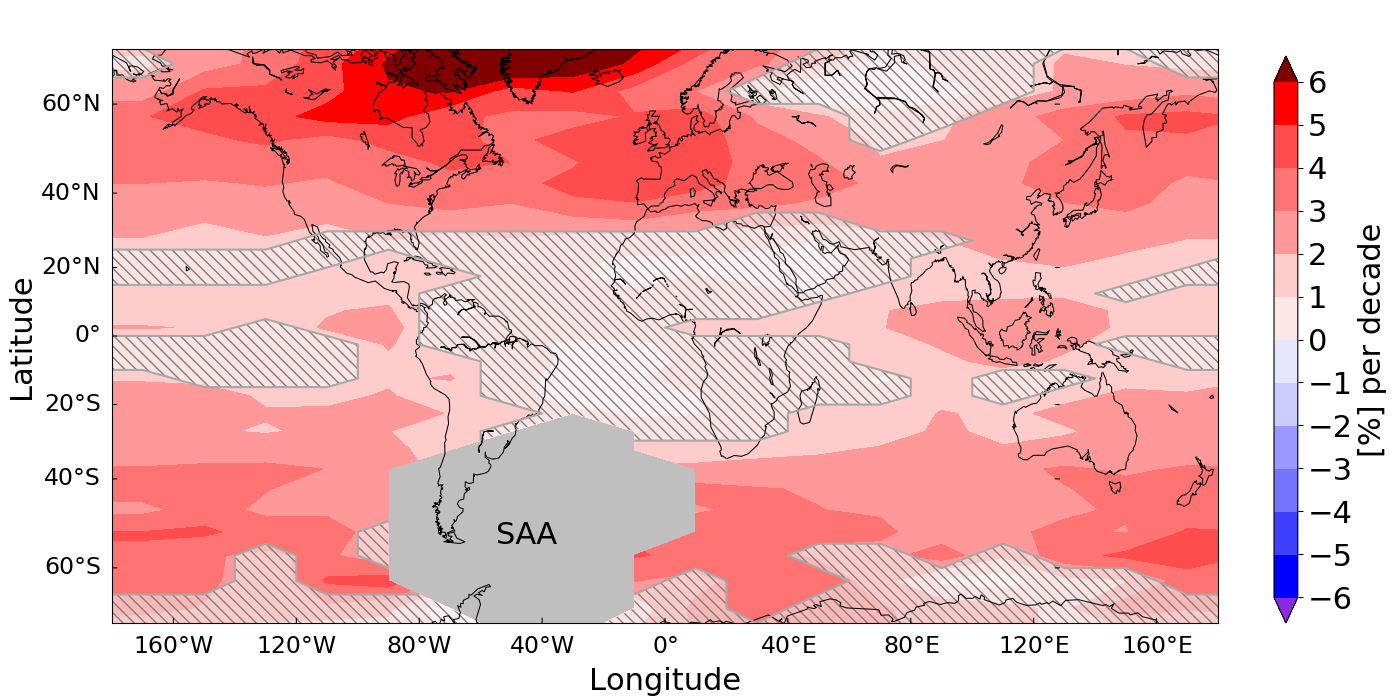
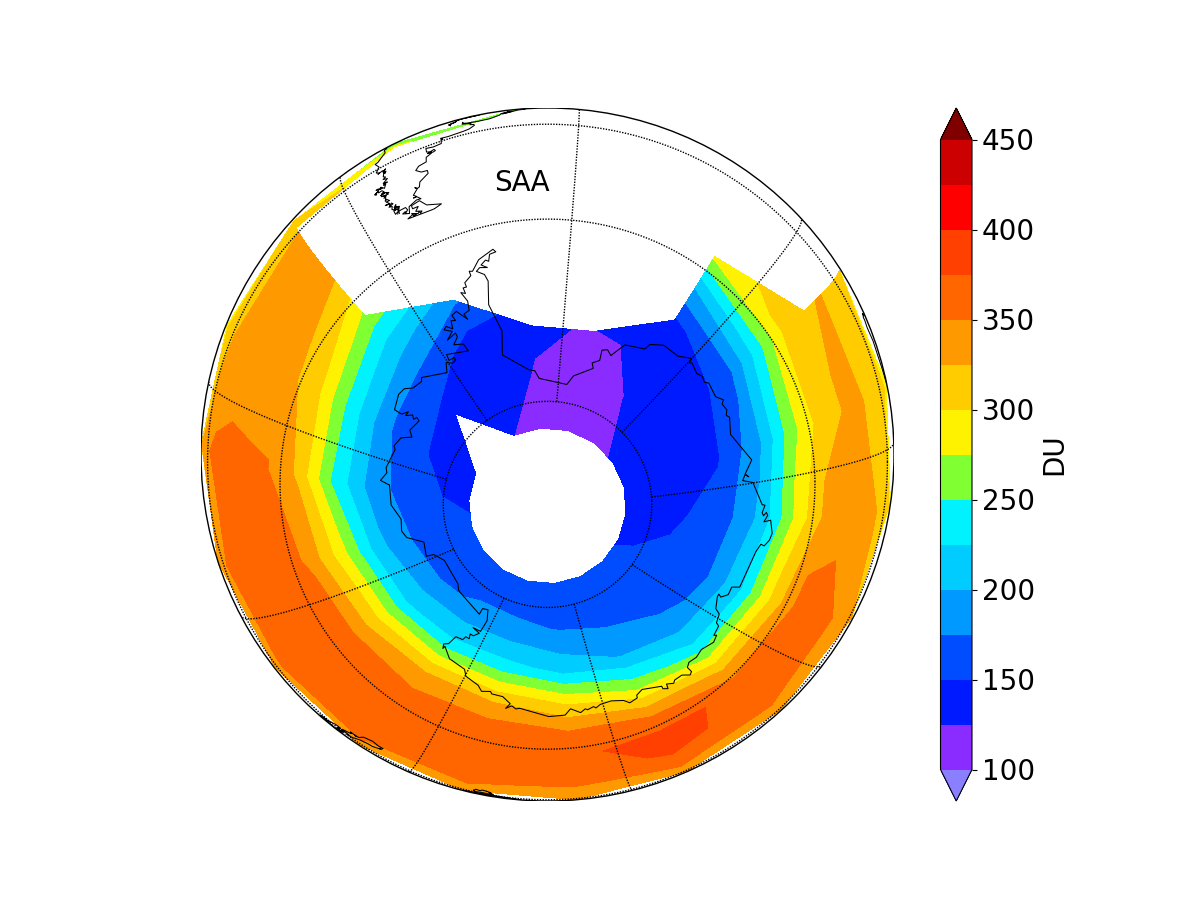
  • Retrieval of vertical distributions of atmospheric trace gases (O3, NO2, H2O, BrO) from SCIAMACHY limb measurement
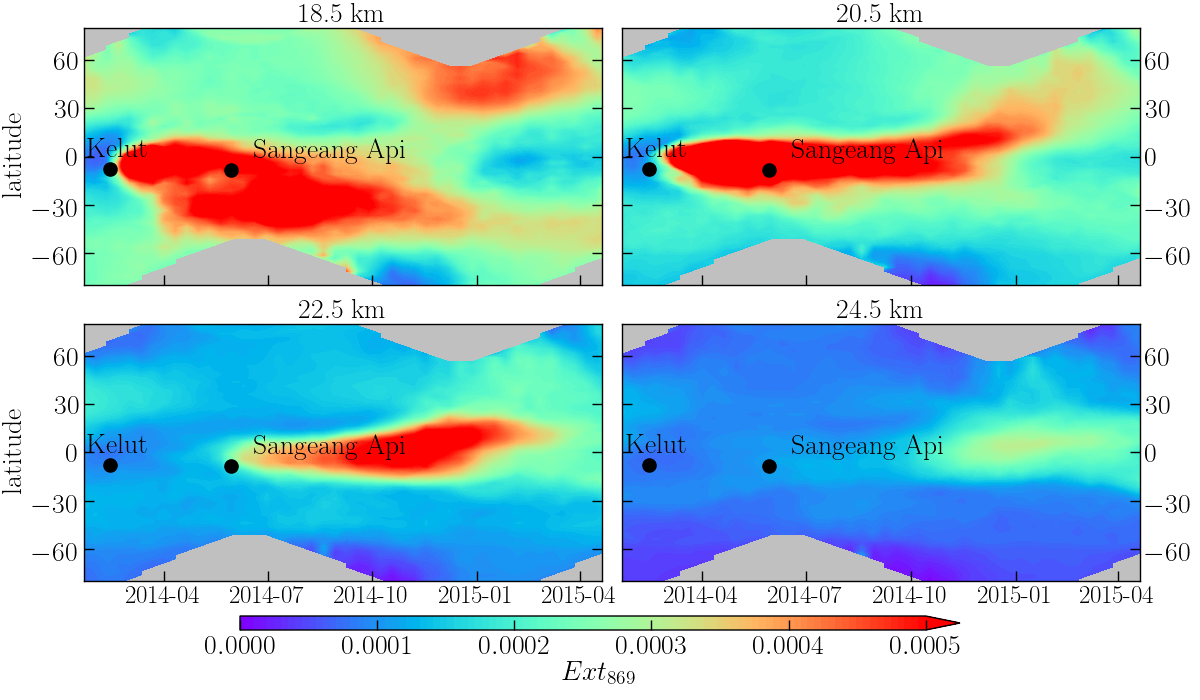
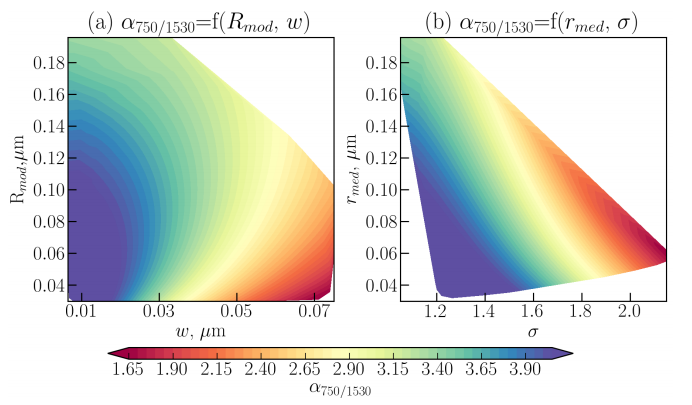
  • Retrieval of vertical aerosol extintion profiles and particle size distributions from OMPS-LP and SCIAMACHY data.

Research highlights

omps_kel_calb_lat_t
Evolution of the aerosol extinction coefficient at 869 nm at different altitudes during Kelut eruptions, based on the 10-day averaged IUP V1.0.9 OMPS-LP product.
setting image
The ozone anomaly time series from 2003 to 2018 is plot in the upper panel from the merged SCIAMACHY/OMPS-LP data set and in the lower panel from a TOMCAT simulation, both at 31.5 km in the -5° to 5° latitude bin. TOMCAT is a chemistry transport model run at the university of Leeds. From the ozone anomalies, the QBO fit term is subtracted to better visualize the trend. Superimposed to the data, linear fit over three periods are drawn, and respective values of the linear change in % per decade are shown at the bottom of each panel. At this altitude we notice a decline in ozone until 2010-2012 (with values close to -10% per decade), whereas after 2011-2012 the ozone amount in this region levelled up to values recorded in mid-2000, resulting in nearly no overall change in ozone. Galytska et al. (2019) explained that seasonal variations of the stratospheric dynamics control these chemical changes.
Trends_zonal_debiased.png
Merging SCIAMACHY and OMPS-LP time series we got an ozone data set, which covers the period 2003-2018. We applied a standard multi-linear regression approach to compute long-term ozone variations. The plot shows the resulting ozone linear trends in % per decade as a function of latitude and altitude; dashed areas indicate non-significant values. Significant changes are found mainly at mid and high latitudes in the upper stratosphere. The ozone recovery is related also to the positive effects of the Montreal Protocol in reducing the emissions of halogen-containing ozone-depleting substances. Negative but non-significant values are found in the lower tropical stratosphere, where the strengthening of the Brewer Dobson circulation is expect to lead to lower ozone concentrations.
Trends_latlon_2003-2018_38km
In this plot longitudinally resolved ozone changes at 38 km are reported, calculated over the period 2003-2018; dashed areas indicate non-significant values. Large variability is observed and the most important feature is the zonal asymmetry at northern mid and high latitudes, with the strongest recovery over the Canadian sector and non-significant values over Siberia. The causes of these patterns are still under investigation, even though they are most probably driven by changes in the atmospheric dynamics. Discussion of the merging approach and trend studies are in Arosio et al. (2019).
Ozone_hole_map_2018_v2_6
Antarctic ozone hole recorded in October 2018. The monthly averaged stratospheric ozone column (DU) using OMPS-LP observations is plotted. SAA indicates the presence of the South Atlantic Anomaly.
setting image
Dependence of the Ångström exponent (α750/1530) on mode radius, Rmod, and absolute distribution width, w (panel (a)). In panel (b) α750/1530 as a function of median radius, rmed, and σ is presented. Plot is based on the SCIAMACHY limb data in the tropics (20ºN - 20ºS).

Staff

-->
Member Topics
Dr. Alexei Rozanov

- Group leader -

  • Radiative transfer modelling in UV-Vis-NIR-TIR spectral range, development of the radiative transfer model SCIATRAN.
  • Development of the retrieval algorithms for the interpretation of the remote sensing measurements in the UV-Vis-NIR spectral range.
  • Retrieval of vertical distributions of atmospheric trace gases (O3, NO2, H2O, BrO) form SCIAMACHY limb measurement.
Carlo Arosio

- Post doc -

  • Retrieval of ozone profiles from limb measurements.
  • Merging ozone data sets.
  • Study long-term ozone changes in the stratosphere.
Dr. Christine Pohl

- Post doc -

  • Stratospheric aerosols retrievals.

Tools and data

Instruments
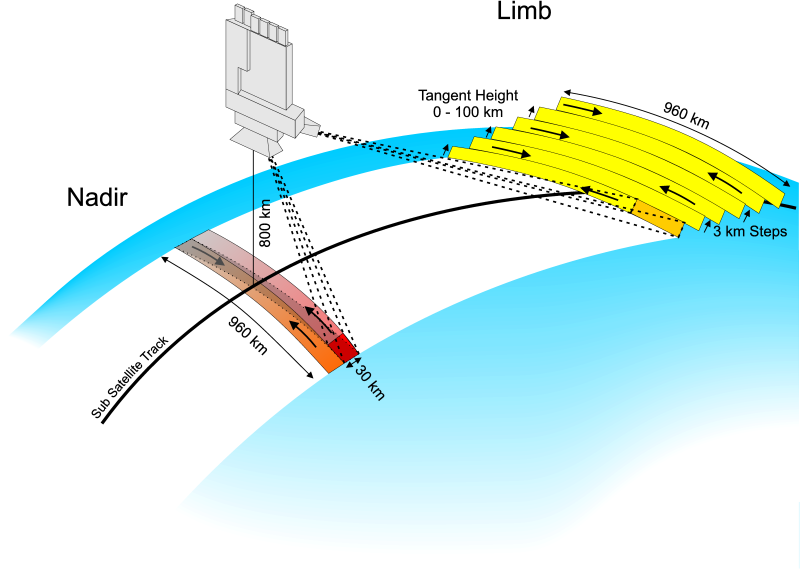
SCanning Imaging Absorption spectroMeter for Atmospheric CHartographY (SCIAMACHY)
Schiamachy image
  • Mission period: 2002 - 2012
  • Spectral range/resolution: 214 – 2386 nm
  • Spectral resolution: 0.22 – 1.48 nm
  • Vertical sampling/field of view: 3.3/2.5 km
  • Horizontal swath/resolution: 960/240 km

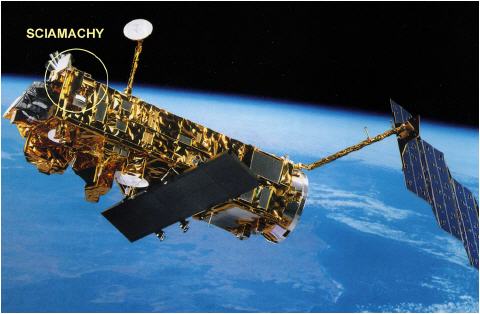
Top: Schiamachy on ENVISAT satellite.
Right: Schiamachy scanning geometry.
Schiamachy image
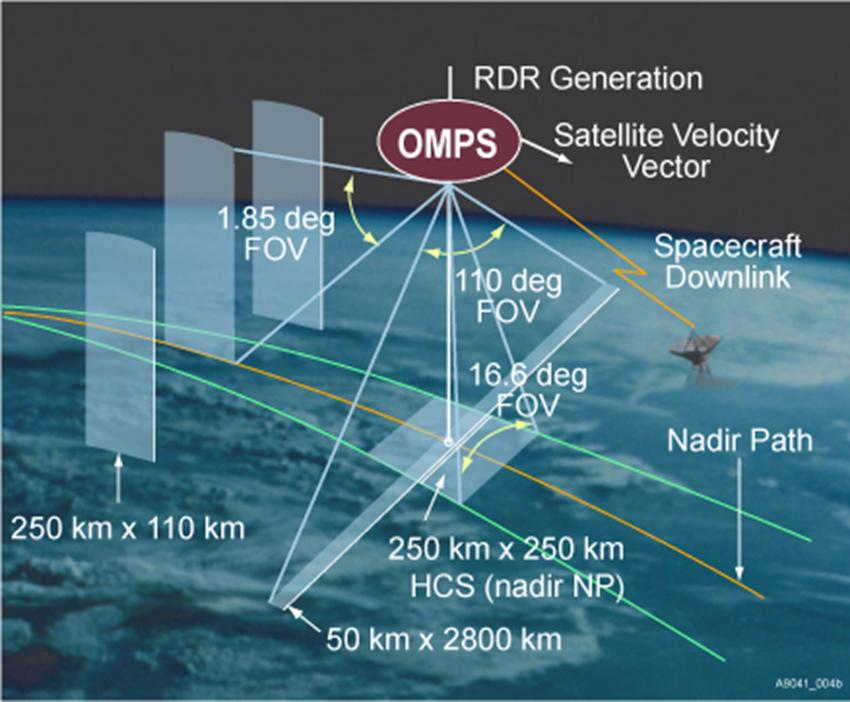
Ozone Mapper and Profiler Suite Limb Profiler (OMPS-LP)
JPSS image
  • Mission period: 2012 - now
  • Spectral range: 290 – 1000 nm
  • Spectral resolution: 1 – 40 nm
  • Vertical sampling/field of view: 1/1.5 km
  • Horizontal swath/resolution: 3x111 km

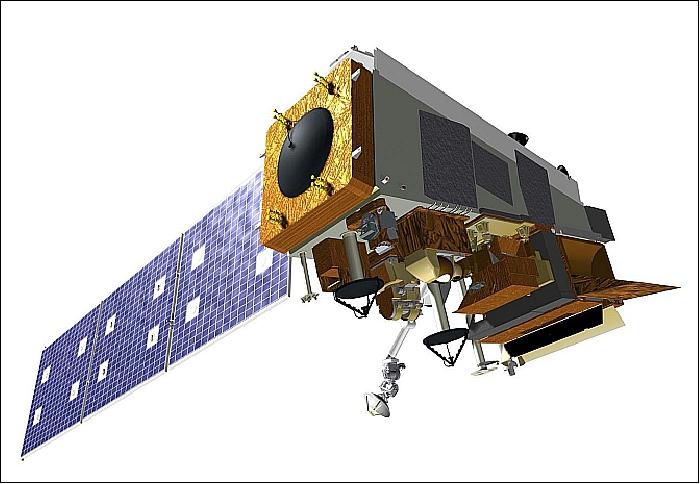
Top: JPSS satellite where OMPS is placed.
Right: OMPS scanning geometry.
OMPS-scanning image
Models
  • SCIATRAN radiative transfer model (Rozanov et al., 2014).
  • TOMCAT/SLIMCAT (Toulouse Off-line Model of Chemistry And Transport/Single Layer Isentropic Model of Chemistry And Transport).
Colaborations
  • Prof. von Savigny, Ernst-Moritz-Arndt-University of Greifswald, Greifswald, Germany.
  • Prof. M. Chipperfield, School of Earth and Environment, University of Leeds.
Projects and initiatives