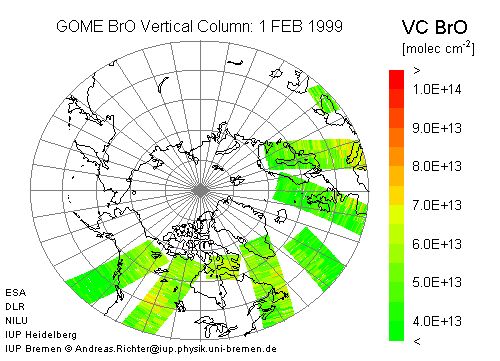
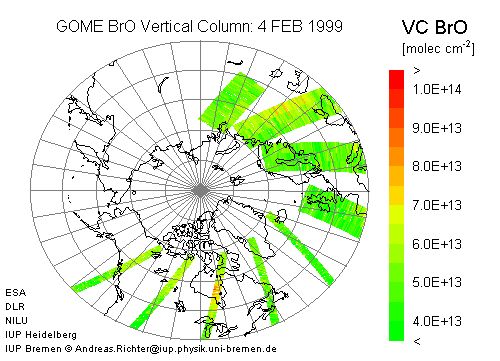
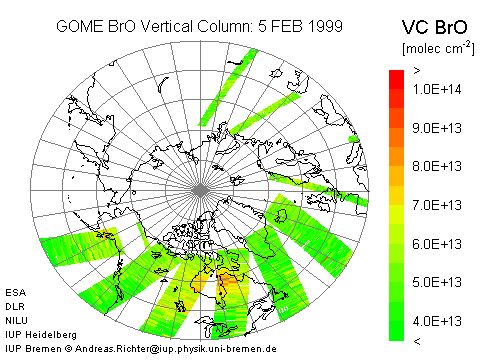
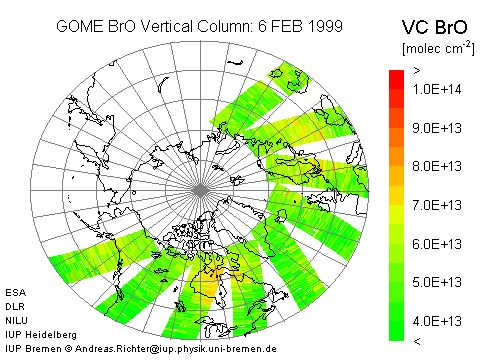
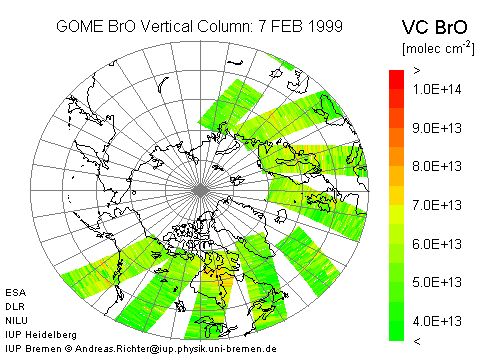
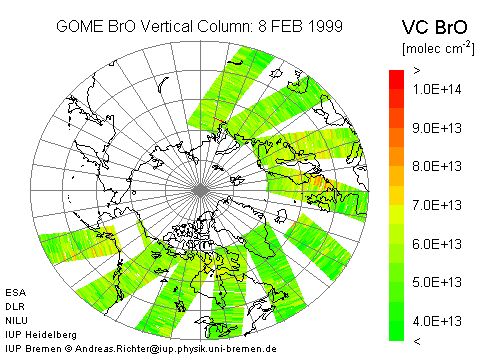
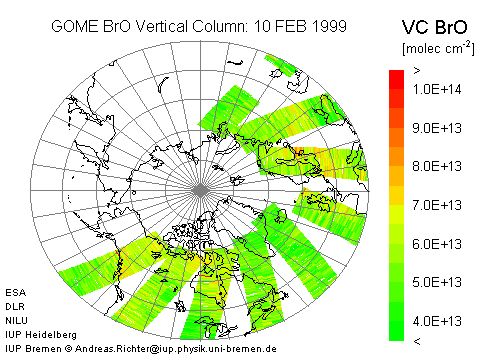
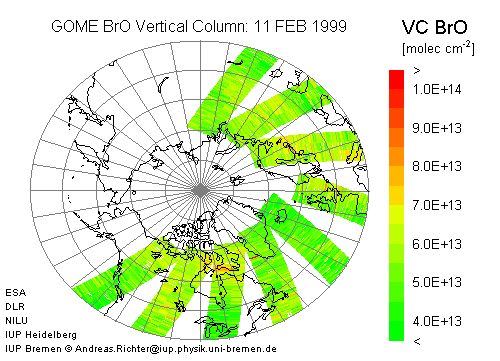
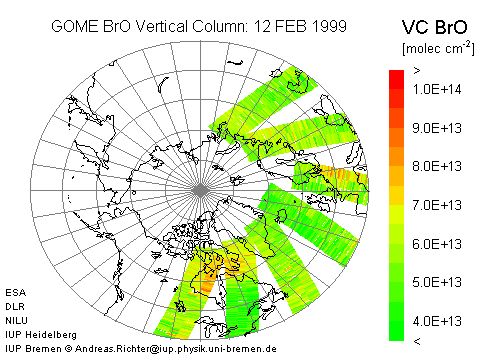
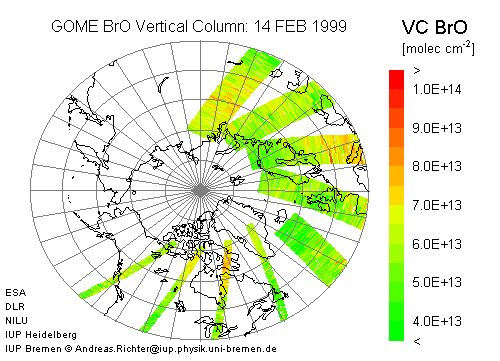
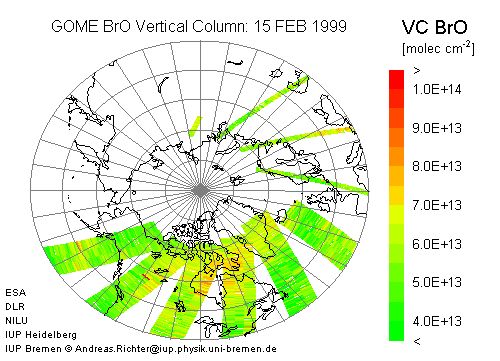
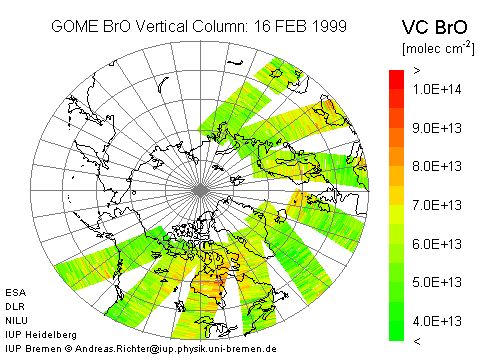
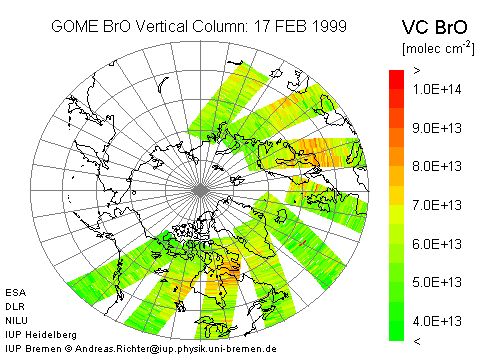
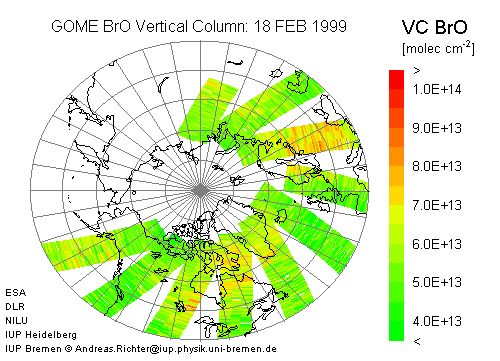
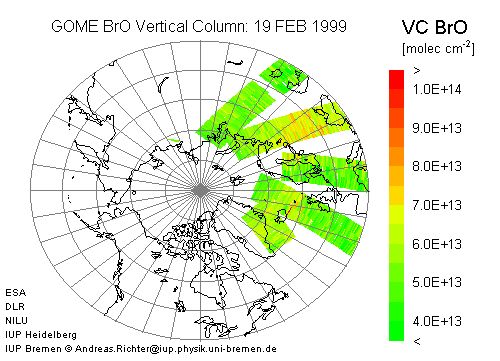
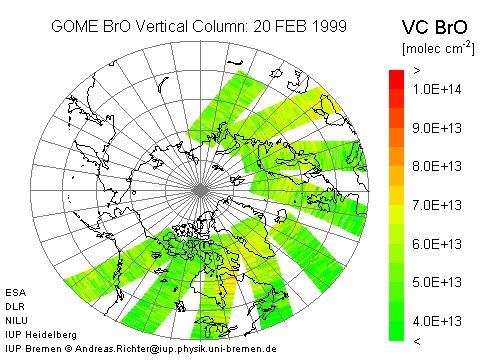
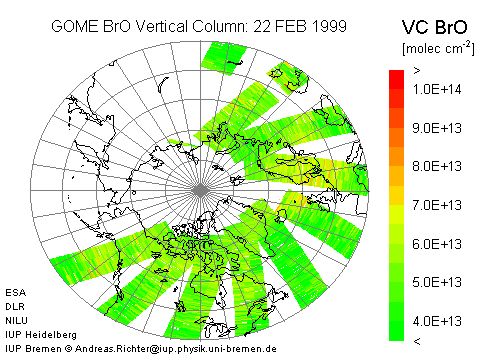
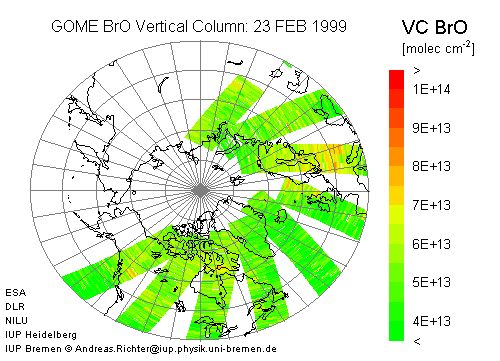
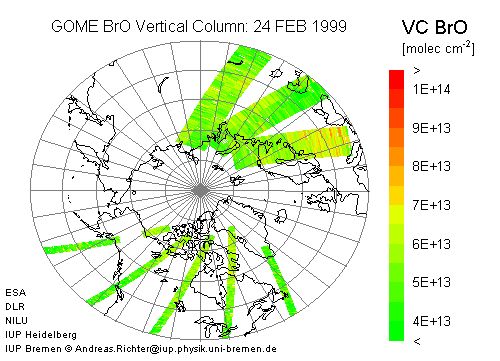
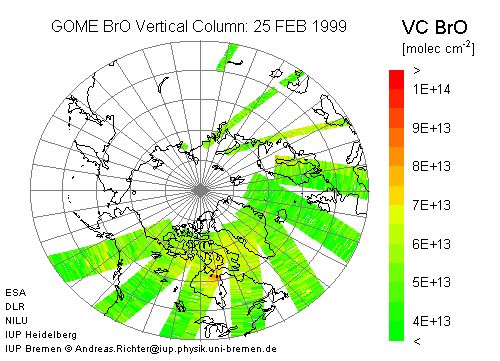
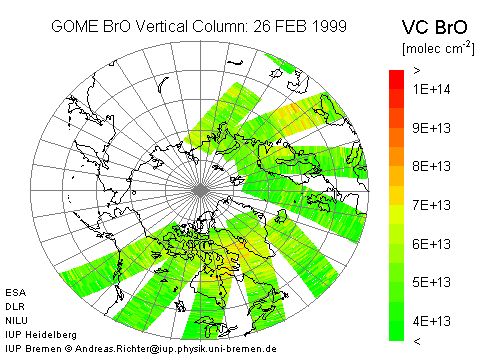
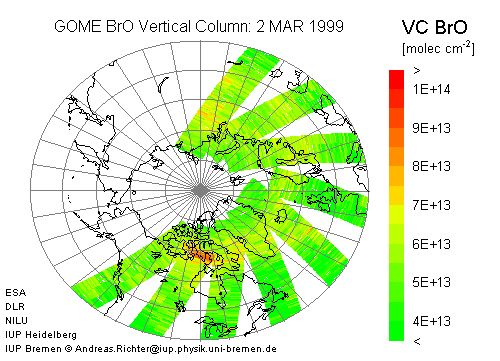
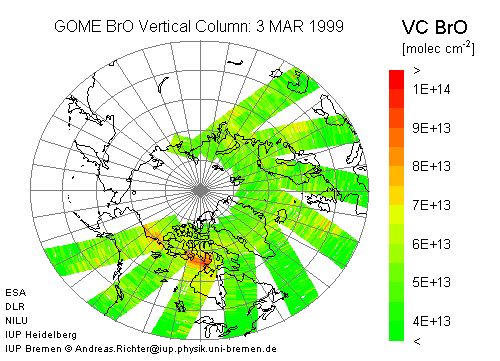
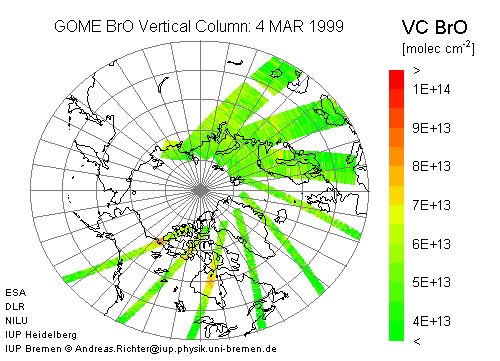
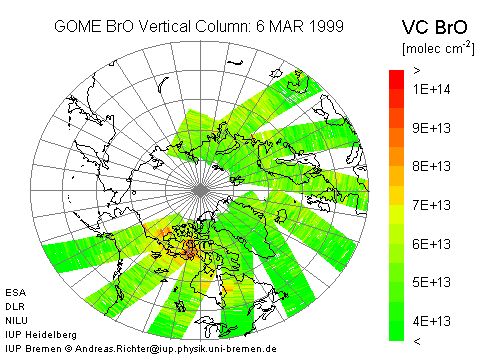
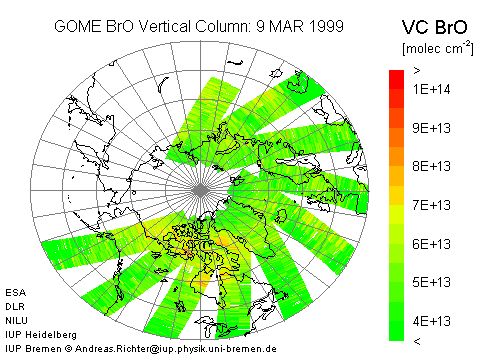
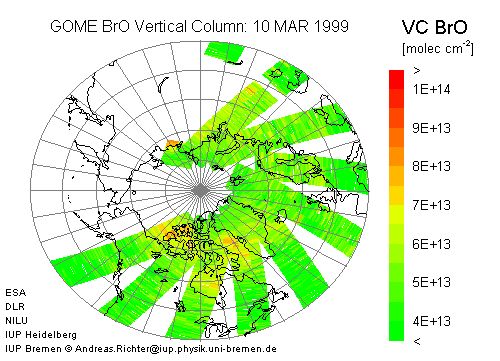
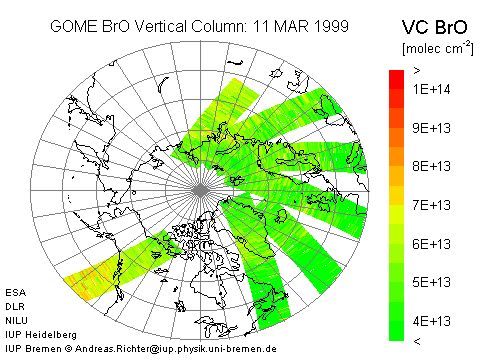
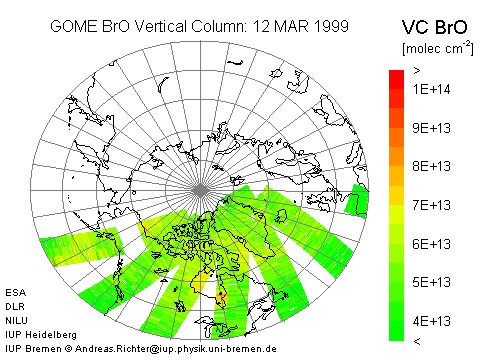
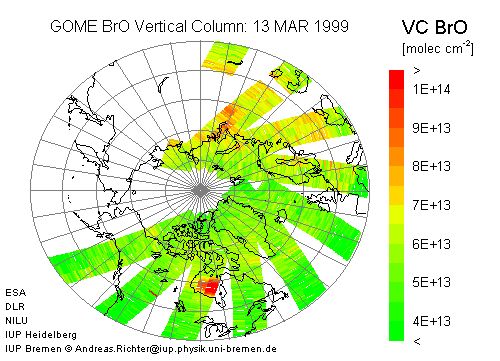
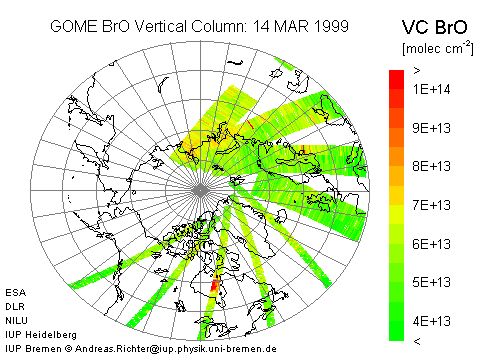
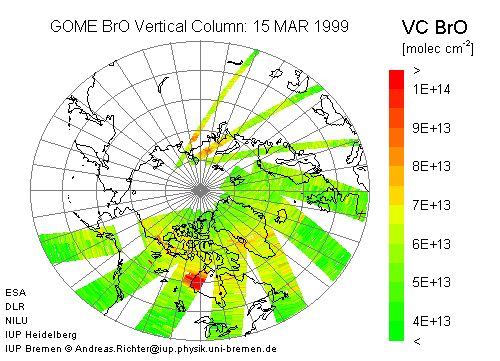
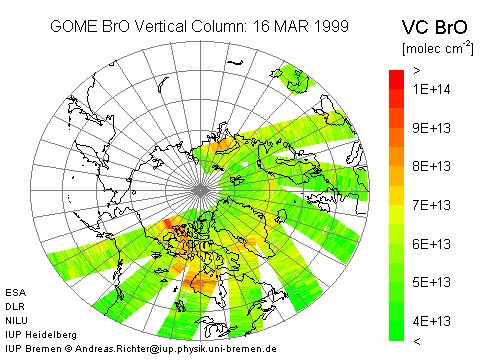
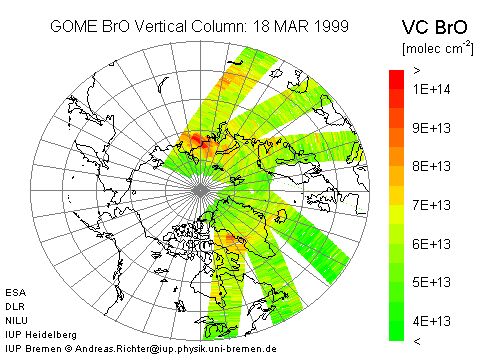
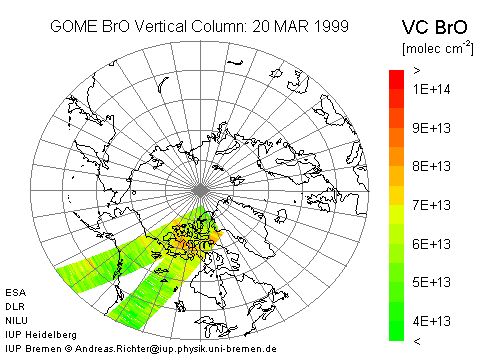
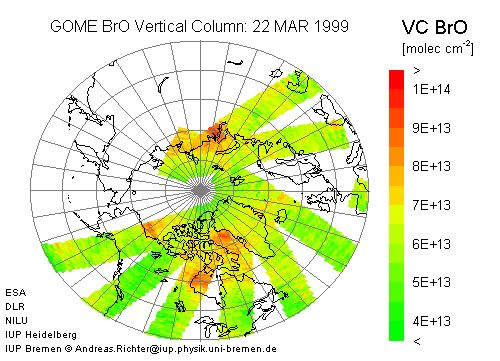
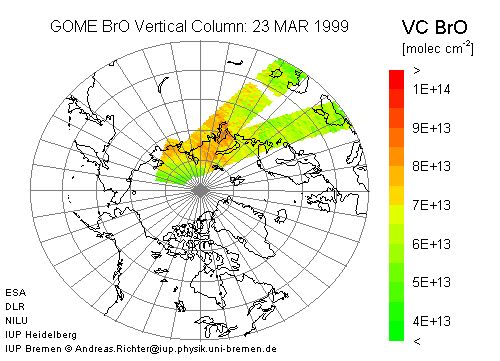
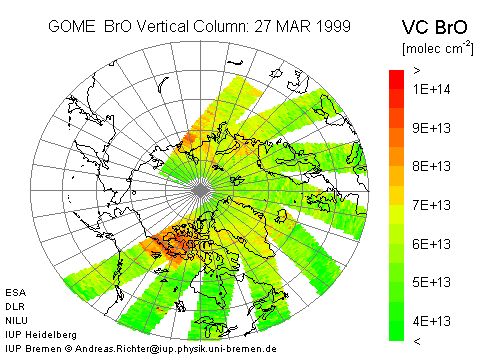
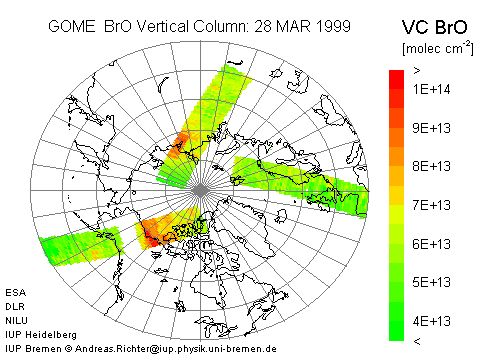
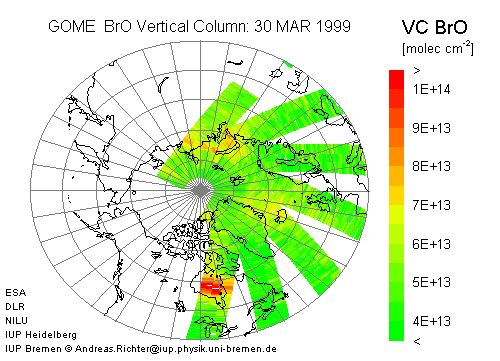
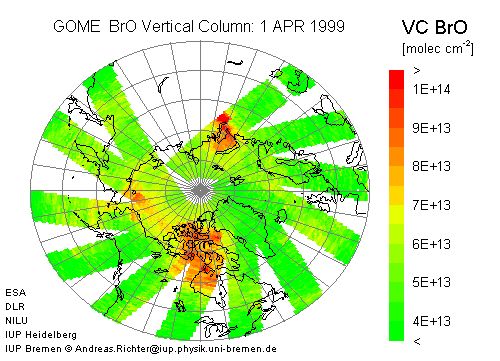
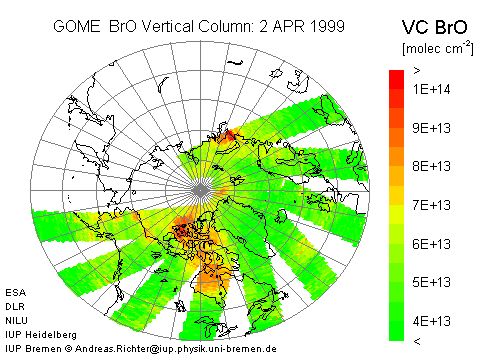
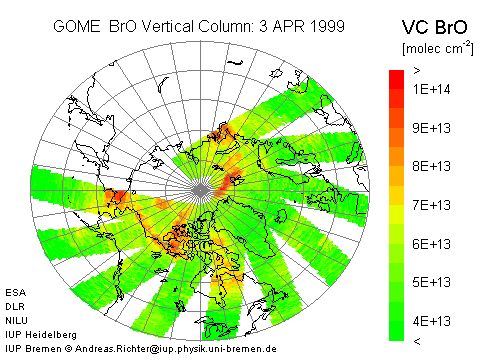
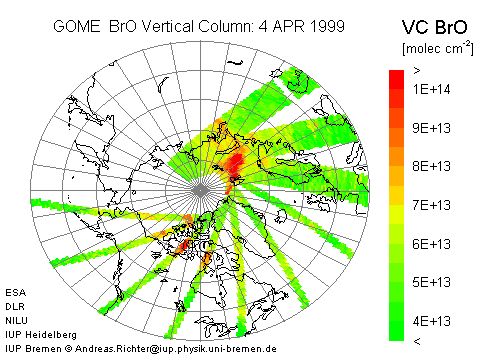
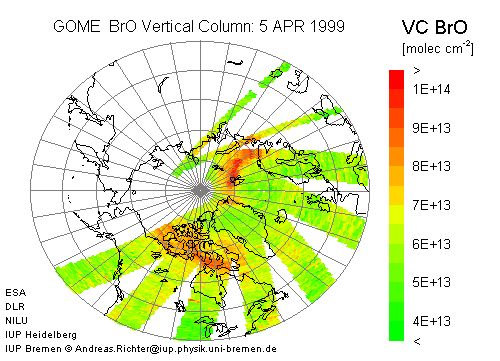
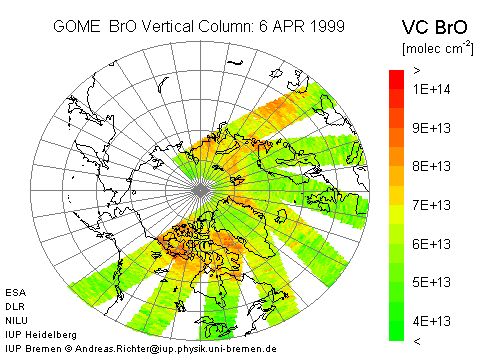
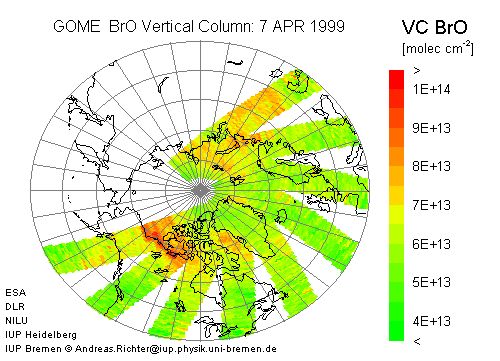
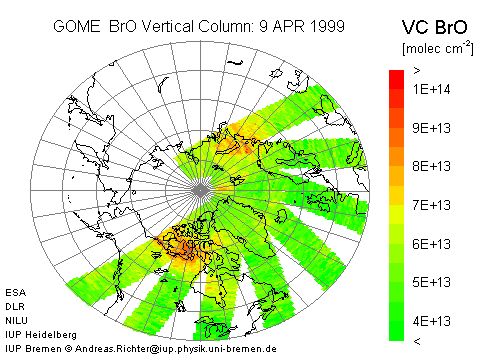
NH GOME BrO Near Real Time Maps 1999

Click on the appropriate day for a plot of near real time BrO.
For a one month overview, click in the first column.
| 99 FEB | 01 | 02 | 03 | 04 | 05 | 06 | 07 | 08 | 09 | 10 | 11 | 12 | 13 | 14 | 15 | 16 | 17 | 18 | 19 | 20 | 21 | 22 | 23 | 24 | 25 | 26 | 27 | 28 | |||
| 99 MAR | 01 | 02 | 03 | 04 | 05 | 06 | 07 | 08 | 09 | 10 | 11 | 12 | 13 | 14 | 15 | 16 | 17 | 18 | 19 | 20 | 21 | 22 | 23 | 24 | 25 | 26 | 27 | 28 | 29 | 30 | 31 |
| 99 APR | 01 | 02 | 03 | 04 | 05 | 06 | 07 | 08 | 09 | 10 | 11 | 12 | 13 | 14 | 15 | 16 | 17 | 18 | 19 | 20 | 21 | 22 | 23 | 24 | 25 | 26 | 27 | 28 | 29 | 30 |
GOME near real time data are preliminary data and are subject to changes in the final evaluation!
The GOME NRT level 1 data products (radiance and solar irradiance) are generated by the GOME data processor (GDP) located at the Kiruna ground station, which is one of five ESA stations receiving global data from the ERS-2 (European Remote Sensing satellite). Ten out of the 14 daily GOME orbits are transmitted to Kiruna. The GDP is operated by the Deutsche Fernerkundungsdatenzentrum DFD of DLR Oberpfaffenhofen.
GOME NRT data for February and March 1999 are provided free of charge by ESA and DLR to the NADIR data base at NILU. The Institute of Environmental Physics highly appreciates this support.
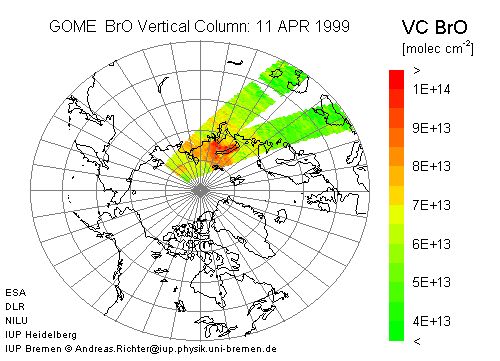
With the Differential Optical Absorption Spectroscopy (DOAS) algorithm, BrO is analysed using its absorption bands in the 344.7 - 359 nm wavelength region. The DOAS analysis results in slant column amounts which are the integral of the absorber concentration along the line of sight. Slant columns are converted to vertical columns using airmass factors derived from radiative transport calculations. A stratospheric BrO profile has been assumed for the airmass factor calculations. It is important to note, that any tropospheric contribution to the BrO column is underestimated by this procedure.
For details on the data evaluation and GOME BrO validation see
- A. Richter, F. Wittrock, M. Eisinger, and J.P.Burrows, GOME observations of tropospheric BrO in Northern Hemispheric spring and summer 1997, Geophys. Res. Lett., 25, 2683-2686, 1998 PDF-File
- A. Richter, F. Wittrock, and J.P.Burrows, GOME observations of tropospheric BrO, in Proceedings of the European Symposium on Atmospheric Measurements from Space, 1999 zipped PS-File
- F. Wittrock, A. Richter, and J.P.Burrows, Validation of GOME BrO and OClO observations in the Northern Hemisphere, in Proceedings of the European Symposium on Atmospheric Measurements from Space, 1999 zipped PS-File
More on BrO from GOME can be found in the following publications:
- T. Wagner and U. Platt, Satellite mapping of enhanced BrO concentrations in the troposphere, Nature, 395, 486-490,1998
- E. Hegels, P.J. Crutzen, T. Klüpfel, D. Perner, and J.P. Burrows, Global distribution of atmospheric bromine oxide from GOME on the earth observing satellite ERS-2, Geophys. Res. Lett., 25, 3127-3139, 1998
- K. Chance, Analysis of BrO measurements from the Global Ozone Monitoring Experiment, Geophys. Res. Lett., 25, 3335-3338, 1998
Additional GOME NRT data can be found at the University of Bremen (ozone profiles), KNMI (ozone columns), DFD/DLR (ozone columns) and NILU (OClO).
© 1999; created by Andreas Richter ; last update 16/04/99.