The GOME Spectrometer
Introduction. On April 21, 1995, the European Space Agency (ESA) launched the Global Ozone Monitoring Experiment (GOME) aboard the second European Remote Sensing satellite (ERS-2) . GOME is the first European passive remote sensing instrument operating in the ultraviolet, visible, and near infrared wavelength regions whose primary objective is the determination of the amounts and distributions of atmospheric trace constituents (see Figure 1). The GOME industrial management was funded by the European Space Agency (ESA) and the industrial consortium was led by Officine Gallileo. The instrument was proposed as a precursor to the Scanning Imaging Absorption Spectrometer for Atmospheric Cartography (SCIAMACHY) to be launched on the ENVISAT-1 platform (1st Environmental Satellite) in June 2001. GOME is a small scale version of SCIAMACHY observing the atmosphere in nadir sounding only and having only four spectral channels, as opposed to eight channels for SCIAMACHY. Second generation GOME-2 are planned for the EUMETSAT MetOp 1, 2, and 3 platforms (2005-2020), extending the European atmospheric chemistry measurement series in the UV/VIS into the next two decades.
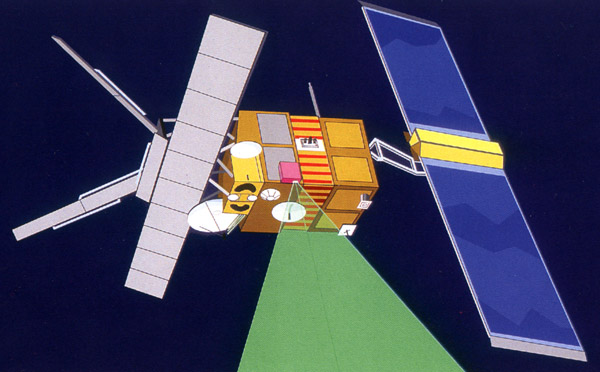
Figure 1. GOME aboard ERS-2 (courtesy of ESA).
During the commission phase of GOME, which lasted from April 1995 until July 1996, a limited amount of data were processed at the Data Processing and Archiving Facility (DPAF) at the DLR Oberpfaffenhofen. The major objective during this phase was the validation of the radiometric accuracy of the GOME solar irradiance and earthshine radiance and validation of trace gas and cloud data products. End of June 1996 nominal operation of the GOME processing chain, providing continuous calibrated data products, commenced at the GOME DPAF. This page attempts to provide a brief overview of the GOME instrumental design, operations, and instrument calibration. For further details the readers are referred to ESA's ERS homepage, where information on other instruments aboard ERS-2 and on the public distribution of calibrated ERS-2 data products can be obtained.
Instrument Details. The GOME
instrument is a double monochromator which combines a predisperser
prism and a holographic grating in each of the four optical channels
as dispersing elements. A schematic diagram of the GOME optical layout
is shown in Figures 2a and 2b. The irradiance and radiance spectra
are recorded with four linear Reticon Si-diode arrays with 1024
spectral elements each. Peltier elements attached to the diode arrays
and connected to passive deep space radiators cool the detectors to
about -40ºC. Except for the scan mirror at the nadir view port,
all spectrometer parts are fixed and the spectra are recorded
simultaneously from 240 nm to 790 nm. The spectral resolution varies
between 0.2nm (UV, Channel 1) and 0.4 nm (VIS, channel 4). Part of the
light which reaches the predisperser prism is branched out and
recorded with three broadband polarization monitoring devices (PMD),
which approximately cover the spectral range in channels 2 (300-400
nm), 3 (400-600 nm), and 4 (600-800 nm), respectively. The PMDs
measure the amount of light at an instrument defined polarization
angle.
Figure 2a. Instrumental Setup of GOME (courtesy of ESA).
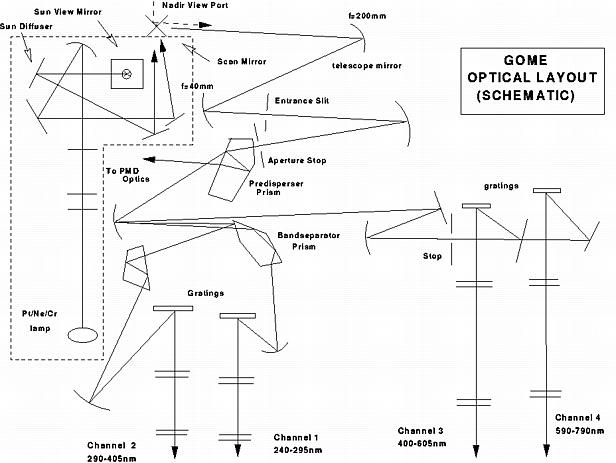
Figure 2b. Schematics of GOME Optics (Weber et al. 1998). The GOME instrument is a four channel spectrometer. Adjacent to the spectrometer is a calibration unit housing a Pt/Cr/Ne hollow cathode discharge lamp for wavelength calibration and the fore optics for solar viewing. Not shown is an additional mirror which directs the lamp light to the solar diffuser plate for diffuser reflectivity measurements.
The calibration unit
adjacent to the spectrometer part consists of the sun view port and a
compartment housing a Pt/Ne/Cr hollow cathode discharge lamp. The
solar radiation is attenuated by a mesh (20% transmission) and
directed via a diffuser plate (wet-sanded Al plate with Cr/Al coating)
on to the entrance slit of the spectrometer. When no solar
measurements are carried out and during nadir and calibration lamp
measurements, a protective shutter is placed in front of the solar
view port in order to avoid unnecessary UV exposure and to prevent
straylight from entering the instrument. The calibration unit becomes
optically coupled to the spectrometer by proper positioning the scan
mirror.
The various pointing geometries of the GOME scan mirror permit in addition to solar and earth nadir viewing, polar viewing (scan mirror angle of 45º), and lunar observations (scan mirror angle of about 80º) at selected times during a year.
Global Earthshine Measurements. The ERS-2
satellite moves in a retrograde, sun-synchronous, near polar orbit at
a height of about 795km. The maximum scan width in the nadir viewing
is 960km and global coverage is achieved within three days (after 43
Orbits). The local crossing time at the equator is 10:30am. An across
track scan sequence consists of four ground pixel types called East,
Nadir, West, and Backscan with 1.5 sec integration time each as
indicated in Figure 3.
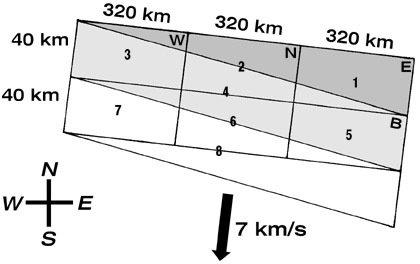
Figure 3. GOME Scan
Geometry in Nadir Viewing (schematic). Two successive scan
sequences are shown. Forward scan consists of East (E), Nadir (N), and
West (W) pixels and is followed by a backscan (B) (light
grey). Channel 1a (240-307 nm, after June 1998 240-283 nm) ground
coverage extends to that of ground pixels numbered 1-8 corresponding
to 12 sec integration time. During the commisioning phase saturation
of the diode arrays were found in cases of high reflectivity (cloud)
scenes. Before a co-adding patch was transferred to GOME in March
1996, integration time was shorten to 0.375 sec in channels 1B, 2, 3,
and 4. The ground coverage was then limited to the last quarter of the
individual pixel areas shown here.
Since the light levels in the UV channel (channel 1) is decreasing
rapidly with descending wavelength, the diode array has been separated
into two sections with different integration times. Channel 1a
(240-283nm, before June 1998: 240-307 nm) requires an integration time
of 12 sec (covering eight ground pixels), while in channel 1b (283-316
nm, before June 1998: 307-316 nm) the spectrum is integrated for
1.5sec. Each spectrum integrated over 1.5sec covers an area of maximum
40×320km² on the ground. About every ten days small scan
width orbits with a across-track width of 240 km are available, of
which one orbit is observed in static nadir. At high solar zenith
angles while crossing the polar regions higher integration times are
selected for all channels. The PMDs are readout sequentially every
93.75 msec, which means that for a nominal East-West scan (4.5sec)
forty-eight PMD measurements are collected for each wavelength
region. Using the maximum possible scanwidth of 960km, each PMD covers
an area of 40×20km² on surface. This makes the PMD
measurements useful for detecting rapid changes in the observed
surface reflectivities and cloudiness during scanning. Table 1
summarizes the GOME/ERS-2 and its measurement capabilities.
Table 1. Fact sheet on
GOME/ERS-2 (after Burrows et al. 1999 and GOMEMANUAL 1995).
| spectrometer type | double monochromator with predisperser prism and four holographic gratings in four channels | |||||||||||||||||||||||||||||||||||||||||||
| detectors | 4 Reticon Si diode arrays (4×1024 pixels)
3 Polarization Measuring Devices (PMD)
|
|||||||||||||||||||||||||||||||||||||||||||
| ERS-2 orbital parameters |
|
|||||||||||||||||||||||||||||||||||||||||||
| viewing modes |
|
|||||||||||||||||||||||||||||||||||||||||||
| nadir spatial resolution |
|
|||||||||||||||||||||||||||||||||||||||||||
| trace gas detection |
|
|||||||||||||||||||||||||||||||||||||||||||
| trace gas retrieval techniques |
| |||||||||||||||||||||||||||||||||||||||||||
| other data | macroscopic cloud parameters, aerosol index, surface reflectivity, solar variability, UV index |
Two examples of
sun-normalized earthshine spectra under different cloudiness
conditions are shown in Figure 4.
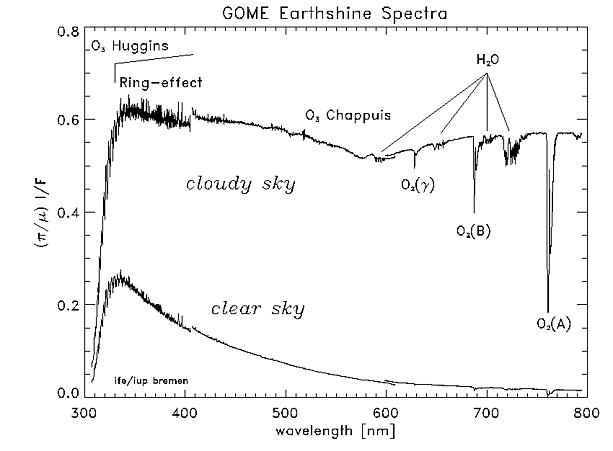
Figure 4. Two Examples of Earthshine Spectra Recorded in September 1995 by GOME (Burrows et al. 1999). The top curve is a reflectivity spectrum for a cloudy scene (cloud cover fraction of 1.0) from 7 September; the bottom a spectrum under clear sky condition (4 September). Both spectra were measured in the North Atlantic region (48N, 30W). Reflectivity is here defined as R=(I/F)(pi/cos SZA), where I is the backscattered radiation, F, the directly measured solar irradiance, and SZA, the solar zenith angle. The absorption of the O2 A-band at 760nm is used to determine the fractional cloud cover.
Solar
Irradiance. Once a day (every fourteenth orbit) GOME solar
irradiance measurements are carried out when the ERS-2 satellite
crosses the terminator in the North polar region coming from the night
side. Since GOME is not equipped to actively track the sun, viewing of
the full solar disc is only possible for a time span of about 50
sec. Integration times are 0.75 sec for all channels, except for the
UV channel, where the integration time is doubled. A mean solar
spectrum is constructed from the series of measurements during full
disc solar viewing. Figure 5 shows a calibrated mean solar spectrum
measured by GOME in 1995.
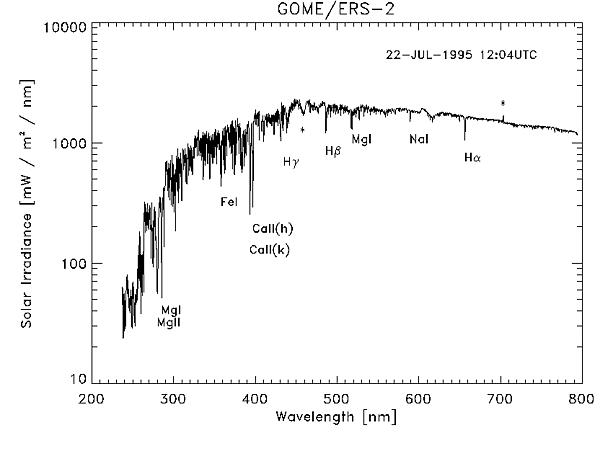
Figure 5. GOME Solar Spectrum from 22 July 1995 (Weber et al. 1998). Selected prominent Fraunhofer lines are shown. Asterisks mark instrumental artifacts due to the changing transmission characteristics of the anti-reflection coating on the channel 3 beamsplitter (450nm) and due to a Wood anomaly in the Channel 4 holographic grating (700nm). The overlap regions of the four optical GOME channels are at 315nm, 405nm, and 600nm.
Internal
Calibration Sequences. A typical GOME orbit lasts about 100
min, half of which are spent in the night side of the earth. During
this phase GOME carries out several sequences of dark current and LED
measurements (pixel-to-pixel gain). Various temperature sensors spread
over the entire focal plane assembly monitor the in-orbit temperature
variations.
Once a month, the internal calibration lamp is switched on over an entire orbit. During this sequence a series of lamp measurements with and without the solar diffuser permits the investigation of long term degradation of the diffuser and an update in the wavelength calibration of the diode arrays, respectively. Prior to launch, the spectral irradiance of the GOME flight model was calibrated by the Dutch firm TPD using a 1000 Watt FEL lamp, which in turn was referenced to an absolute standard at NIST. The absolute accuracy of the NIST standard is quoted to be 1 to 3% in the range 250-340nm. Spectral radiance of GOME was calibrated by placing a Spectralon diffuser plate between the FEL lamp and the nadir scan mirror. In cooperation with NASA Goddard Space Flight Center and ST System Co., Boulder, CO, the Spectralon diffuser plate was compared with the NASA integrating sphere, which served as a radiance standard to calibrate the SBUV/2 and SSBUV instruments. The agreement between the two standards is within 1%. The radiance response was determined as a function of the scan mirror angle.
Suggested Reading:
Burrows, J.P. et al., 1999: The Global Ozone Monitoring Experiment (GOME): Mission Concept and First Scientific Results, J. Atmos. Sci. 56, 151-175.
ERSCONF, 1997: Proceedings of the 3rd ERS Conference, ESA Special Publication 414, Vol. II, Florence, Italy, 17-21 March 1997.
GOMESCIENCE, 1993: GOME Interim Science Report, ESA Special Publication 1151, ESA/ESTEC, Nordwijk, The Netherlands.
GOMEMANUAL, 1995: GOME Users Manual, ESA Special Publication 1182, ESA/ESTEC, Nordwijk, The Netherlands.
GOMEVAL, 1996: Geophysical Validation Campaign Workshop Proceedings, ESA WPP-108, ESA/ESTEC, Nordwijk, The Netherlands.
Weber, M., J.P. Burrows and R.P. Cebula, GOME Solar UV/VIS Irradiance Measurements between 1995 and 1997 - First Results on Proxy Solar Activity Studies, Solar Physics 177, 63-77, 1998.
©1996 written by
Mark Weber
last change: 01/06/2001.
Institute of Environmental
Physics, University of Bremen