*Glyoxal
1) UV/vis absorption cross section of Glyoxal at 296K
Experimental conditions:
- Mixtures of glyoxal and N2.
- Static mode, pressure: range 0.4 to 13.4 mbar of glyoxal in 1 atm N2.
- Room temperature: 296K
Spectroscopic conditions
- Analysis light source: Xenon arc lamp(UV-VIS) / globar lamp (IR).
- Detection system:
- Fourier Transform Spectrometer (Brucker IFS-120 HR)
- Resolution: 0.001nm, 0.01nm, 0.1nm and 1nm FWHM
- Reaction vessel: glass, 83.5 cm, multi path optics (White type), mirrors: Al, path length 1.64 cm
Analysis
-Amount of glyoxal determined by converting pressure variation in an empty vessel into concentration. 1 atm N2 was added after pressure variation measurement.
-Cell leak rate and glyoxal losses were characterised and the glyoxal pressure was accordingly corrected
-Lamp drift characterised and corrected.
-the combination of all remaining error sources yields an overall error which is 5% or better, but not less than 2×10-22 cm²/molec.
Absolute scaling
-by direct measurement of pressure (see "Analysis" above).
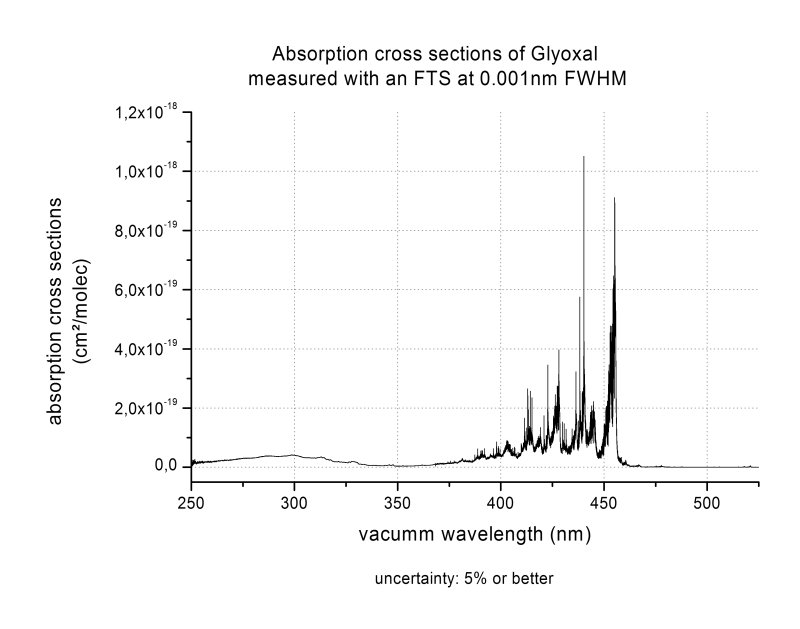
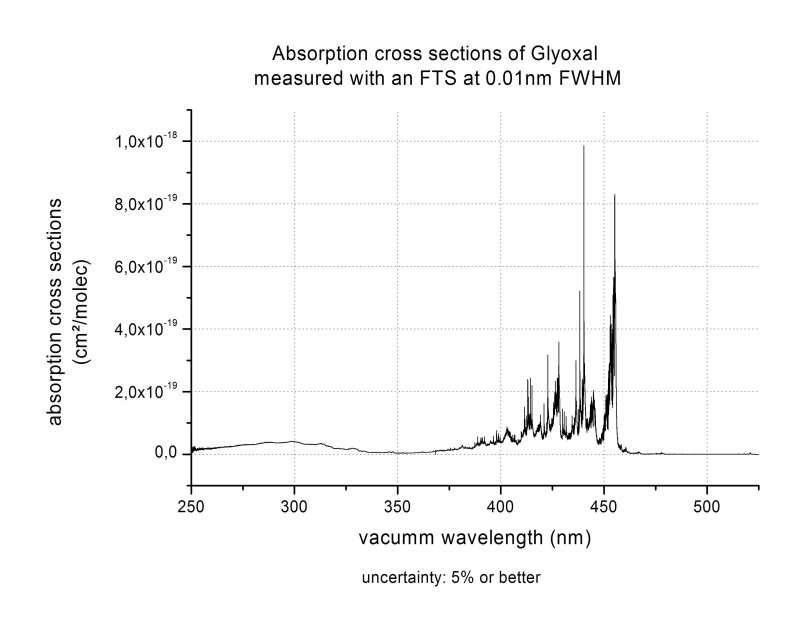
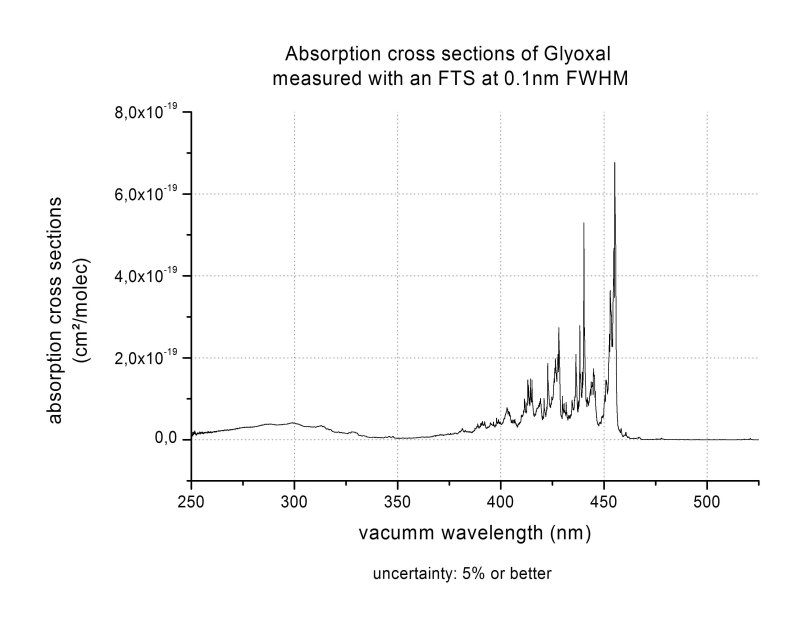
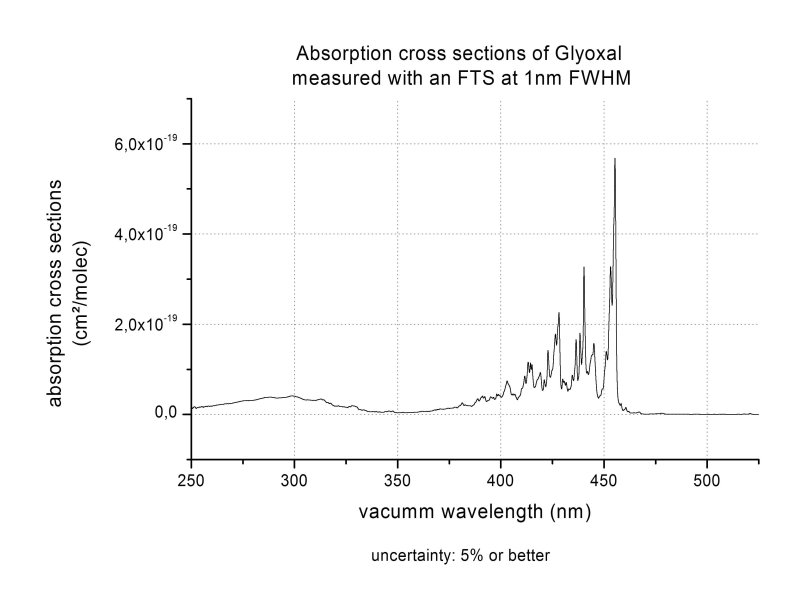
UV-Vis Data (250 - 526nm):
0.001nm FWHM
ASCII DATA: glyoxal_0.001nmFWHM_IUP.zip
FIGURE : glyoxal_0.001nmFWHM_IUP.jpg
0.01nm FWHM:
ASCII DATA: glyoxal_0.01nmFWHM_IUP.zip
FIGURE : glyoxal_0.01nmFWHM_IUP.jpg
0.1nm FWHM:
ASCII DATA: glyoxal_0.1nmFWHM_IUP.zip
FIGURE : glyoxal_0.1nmFWHM_IUP.jpg
1.0nm FWHM:
ASCII DATA: glyoxal_1.0nmFWHM_IUP.zip
FIGURE : glyoxal_1.0nmFWHM_IUP.jpg
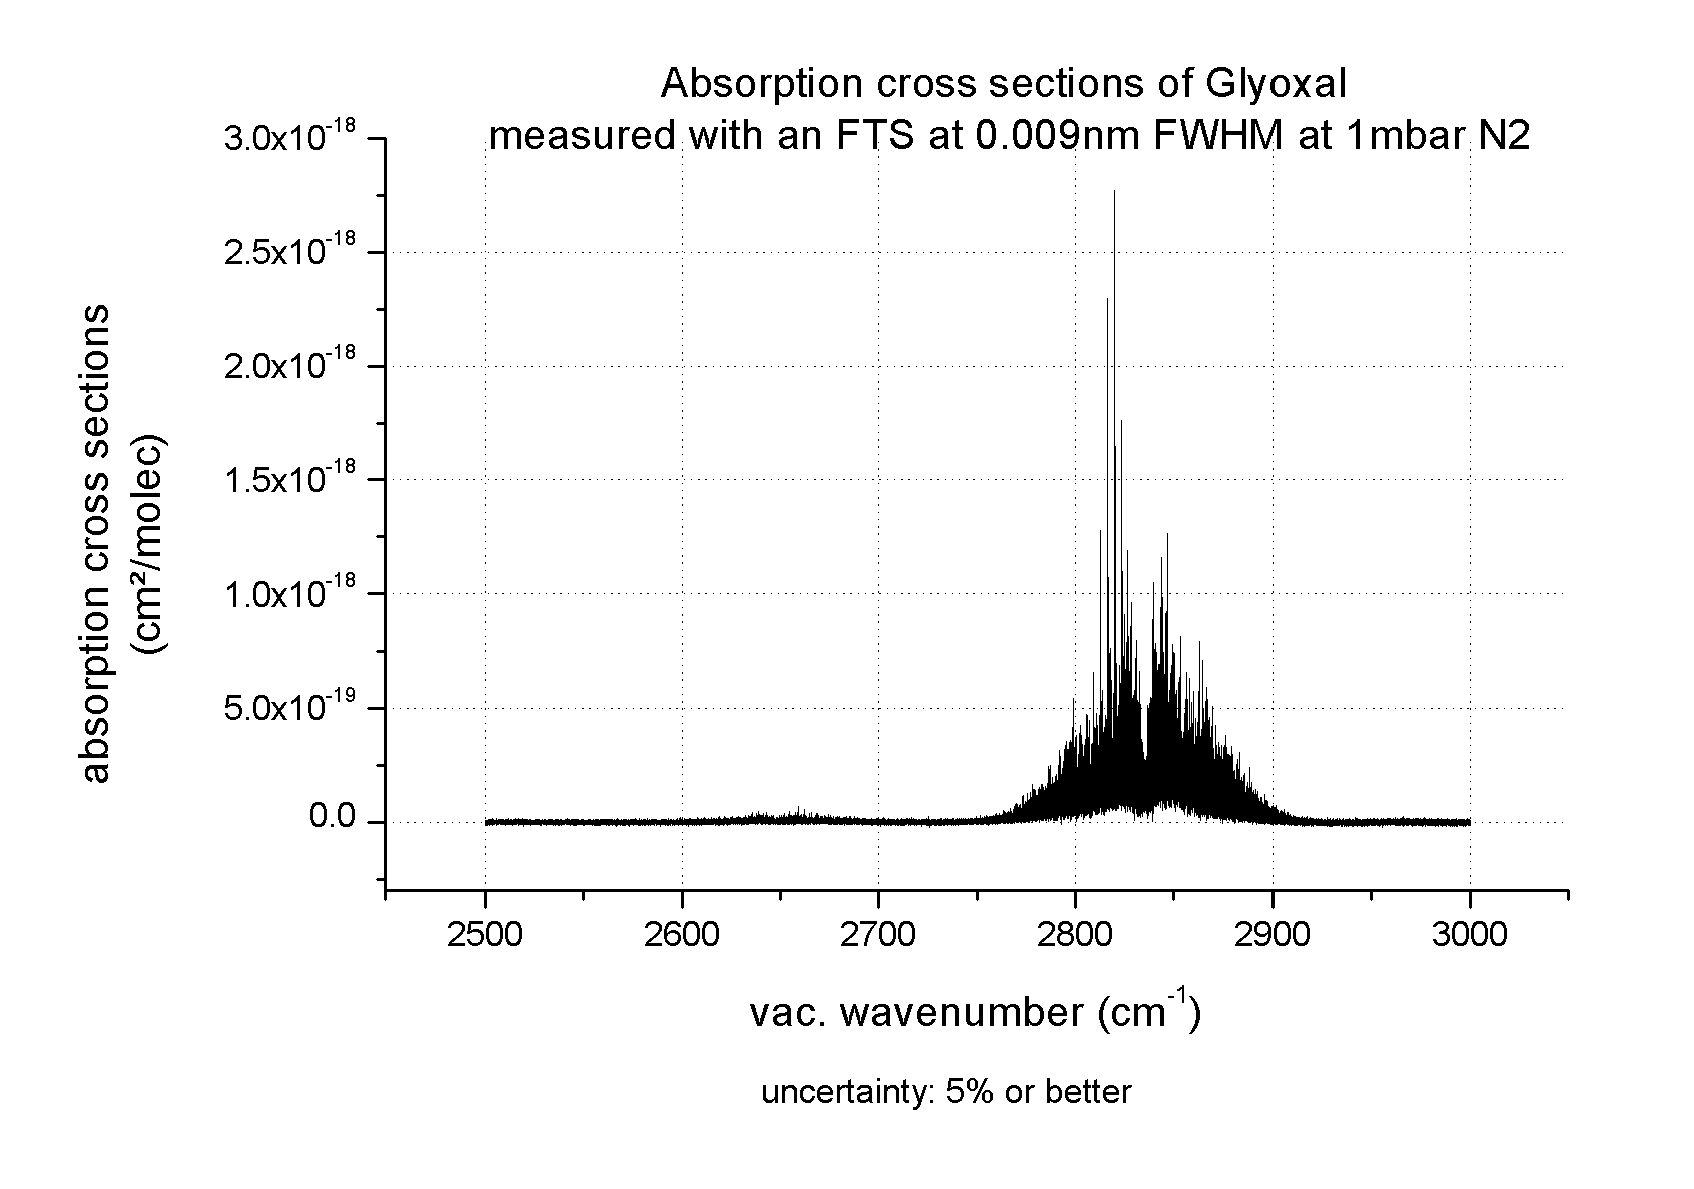
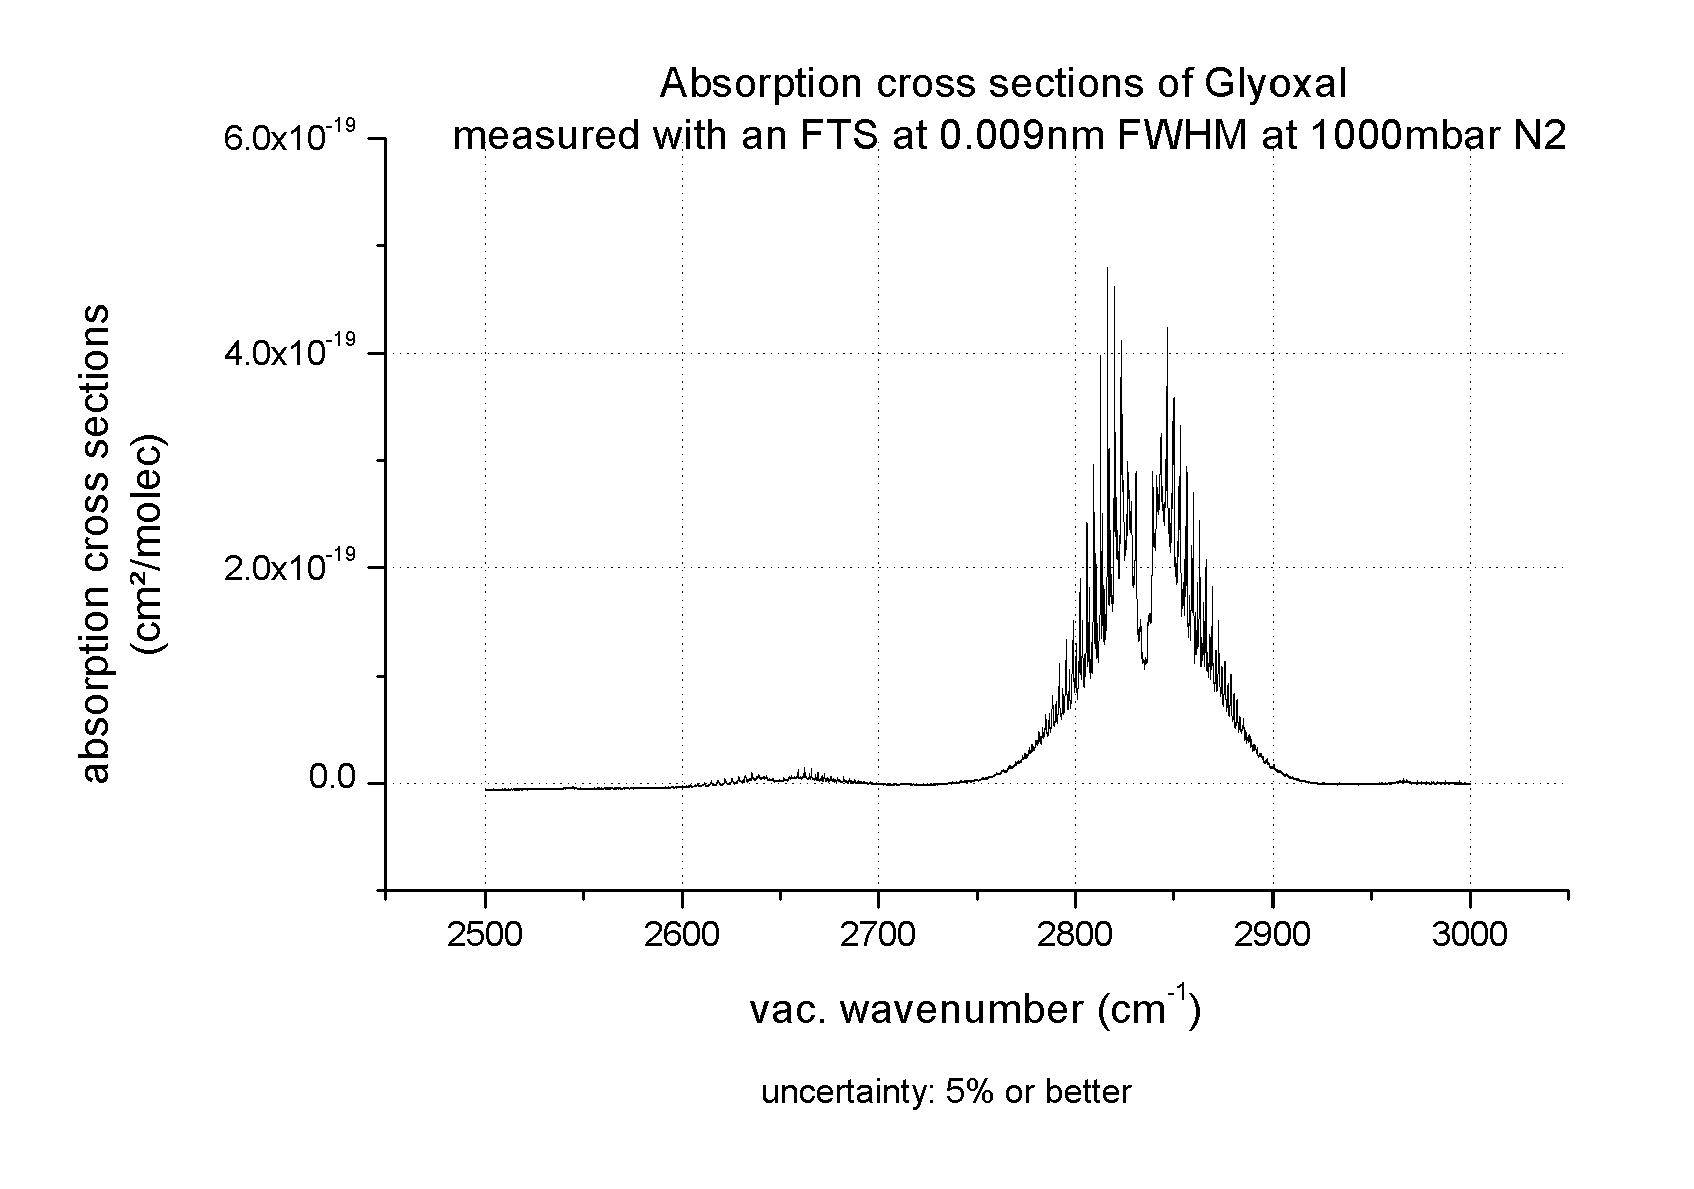
IR Data (2500-3000cm-1):
0.009cm-1FWHM:
ASCII DATA: Glyoxal_IR_0.009cmFWHM_IUP.zip
FIGURE (in 1 mbar N2): Glyoxal_IR_0.009cmFWHM_1mbar_IUP.png
FIGURE (in 100 mbar N2): Glyoxal_IR_0.009cmFWHM_100mbar_IUP.png
FIGURE (in 300 mbar N2): Glyoxal_IR_0.009cmFWHM_300mbar_IUP.png
FIGURE (in 1000 mbar N2): Glyoxal_IR_0.009cmFWHM_1000mbar_IUP.png
Published: Volkamer R; Spietz P; Burrows J; Platt U.; High-resolution absorption cross-section of Glyoxal in the UV/vis and IR spectral ranges, J. Photochem. Photobiol. (2005) 172, 35. DOI: 10.1016/j.jphotochem.2004.11.011