Introduction
Sea ice is an integral part of the climate system of the high latitude regions. Up to now, control of its occurrence and extent, especially its interannual and long-term variability, has proved difficult to isolate or quantify, especially in the data devoid regions of the Southern Ocean. The consequences of climate change induced, for example, by the continued increase of greenhouse gases, on the occurrence of sea ice, is even less certain, although the theory at least suggests that sea ice extent changes could be expected to have a positive feedback role, i.e. that reduced ice extent could be expected to enhance warming at high latitudes.
The interaction of sea ice with the polar ocean and atmosphere can be summerized as follows:
- The snow covered sea ice reflects the solar illumination much stronger compared to open water areas. Therefore, changes in the horizontal coverage of sea ice (ice concentration) would be related to changes of the surface reflectivity. In the polar winter, sea ice isolates the ocean from the cold polar atmosphere and reduces the heat transfer by one or two orders. Both has a strong impact on the radiation balance.
- Sea ice growth and melting has a signinficant influence on the circulation of the oceans. The formation of sea ice increases the water density of the ocean boundary layer due to rejection of brine. This results in an unstable stratification of the ocean layer and deep water formation can occure. The opposite behaviour can be observed when sea ice melts. The additional freshwater causes the ocean to form a stable boundary layer.
Ice concentration from passive microwave sensors
Satellite passive microwave imagers are measuring the upwelling radiation from the ground. The instruments are especially suited to monitor sea ice in polar regions because:
- The high contrast between sea ice and ocean in the microwave
regime up to
37 GHz allows the data to be used to determine the extent and concentration of ice cover.
- Current imagers deliver global coverage on a daily basis.
- Measurements are independent of night and day.
- The influence of the atmosphere is small in comparison to imagers operating in the infrared and visible regime of the spectrum.
Satellite passive microwave imagers have provided this information for most of the past 20 years and are presently an integral part of operational monitoring programmes that will be continued into the foreseeable future. The potential of passive microwave data to observe sea ice distributions on a global scale is demonstrated with an animation of the annual cycle of ice concentration in the Antarctica.. The passive microwave sensors considered in this study are:
- Scanning Multichannel Microwave Radiometer (SMMR) on board the Nimbus-7 satellite (1978-1987).
- Special Sensor Microwave / Imager (SSM/I)
on board the DMSP-satellites
(1987 until now).
Time series analysis
The extend of the sea ice in the Antarctica has been investigated from SSM/I ice concentrations. The NASA-Team algorithm (Cavalieri et.al., 1984) was used to calculate the ice concentration. A new scheme to correct the impact of the atmosphere on the microwave signal at low ice concentrations and open water has been delveloped (Thomas and Heygster, 1996).
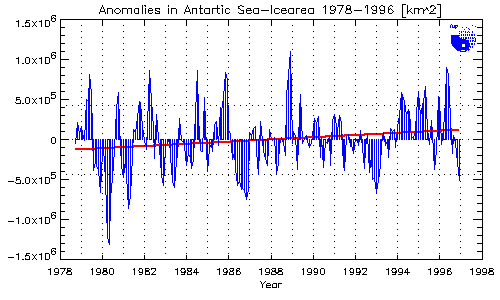
For the trend analysis ice concentrations were averaged monthly. In order to remove the high seasonal variability, the climatological monthly mean was subtracted from the data to get the ice extend and icearea anomalies. The full SMMR period (1978-87) has been analyzed with an inter-sensor corrected NASA Team algorithm, the full SSM/I period (1987-96) with inter-sensor and weather corrected NASA-Team algorithm. Both time series have been combined in order to form a period of 18 years.
 >
>
The above figure shows the combined and corrected SMMR-SSMI time series of the last 18 years. The icearea anomalies (blue) have been plotted as well as the trend (red).
 >
>
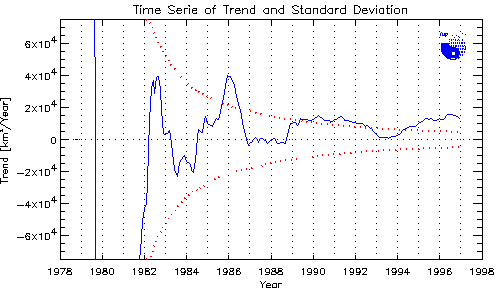
The above figure shows the trend when only a subset of the time series was considered, beginning in 1978 ("The trend of the trend"). At the beginning of the investigation periode strong oscillations (blue) and a large standard deviation (red) can be observed. Both are decreasing year by year. In 1994 the trend started to be slightly larger than the standard deviation which confirms a positive trend. This means that we have a statistically significant positive trend of 1.55% per decade at the moment. The standard deviation of the estimate of the slope is 35%. The anomalies of the last years are mostly positive which caused the positive trend.
A detailed statistical analysis with an autoregressive model was made to confirm the results coming from linear regression. It was found that the significance of the trend of the ice-area time series without the weather correction scheme exceed the 95% confidence level. But the trend of the corrected ice-area time serie is not statistical significant.
Further observation of the Antarctic sea ice and a full statistical time serie analyse will be necessary to confirm or reject the trend-hypothesis. The uncertainty in the linear trends decreases with the length of the time series, emphasizing the importance of the intersensor calibration (SMMR and different SSM/I sensors). As the time series needs to be prepared as homogenous as possible, it is desirable to derive the weather correction scheme for the SMMR data by replacing the 21 GHz data with those of the adjacent 18 and 37 GHz channels and it is also desirable to derive a nonlinear intersensor calibration.
Animation of the annual cycle of sea ice concentration in the
Antarctica
Sorry, but your browser can't run JAVA applets, so here's just a picture :

This JAVA-applet shows the Antarctic continent (black) and illustrates the dynamic of the surrounding sea ice. When you push the LOAD button the film will be loaded (about 250 KBytes) and the video player will be started. Weekly mean ice concentrations are shown for a whole year. Usually not all images can be captured during the first cycle (sometimes not even one!), but the remaining ones are picked up step by step in the following loops.
Features of the video player:
- START: start the film
- STOP : stop and rewind
- PAUSE: stop
- > : step forward
- > : step backward
- >> : fast forward
- << : fast backward
- GRID : The ice concentrations can be displayed with 75,
50 and 25 km grid size.
The size of the data sets you have to load is:
75 km ~ 250 KByte
50 km ~ 400 KByte
25 km ~ 1 MByte (for INTRANET purpose only) - YEAR : Select on year between 1988 and 1994. The film has to be reloaded.
- DELAY : Select the delay between two images (approx. in sec) .
Project members
- British Antarctic Survey
- John Turner jtu@pcmail.nerc-bas.ac.uk
- Tom Lachlan-Cope
- Steve Harangozo
- University of Bremen, Institute of Remote Sensing
- Georg Heygster heygster@physik.uni-bremen.de
- Christian Thomas cthomas@diana.physik.uni-bremen.de
- Thomas Hunewinkel hunewinkel@werum.de
- Technical University of Denmark, Danish Center of Remote Sensing
- Leif Toudal ltp@emi.dtu.dk
- Alfred Wegener Institute (AWI) Bremerhaven
- Peter Lemke (now at the Institute for Marine Research, Kiel) plemke@awi-bremerhaven.de
- Hellmut Schottmueller (now at the University of Bremen) hschottm@informatik.uni-bremen.de
Links to oher sites