Georg Heyster, Lars Kaleschke, September
2002.
The First AMSR-E 89 GHz Sea Ice Images
Two new passive microwave sensors AMSR and AMSR-E, both developed
by the National Space Agency of Japan (NASDA),
with improved resolution and additional channels at 6 and 10 GHz are currently
near launch:
The instantaneous field-of-view (IFOV) of the various obervation
frequencies of the both instruments AMSR and AMSR-E is two to three times
finer than that of the corresonding SSM/I channels.
| AMSR(-E) CHARACTERISTICS |
|
FREQUENCIY (GHz)
|
6.925
|
10.65
|
18.7
|
23.8
|
36.5
|
89.0
|
IFOV
(km x km)
|
74 x 43
|
51 x 30
|
27 x 16
|
31 x 18
|
14 x 8
|
6 x 4
|
SAMPLING RATE
(km x km)
|
10 x 10
|
10 x 10
|
10 x 10
|
10 x 10
|
10 x 10
|
5 x 5
|
We are using the ARTIST Sea Ice algorithm
(ASI) to estimate the ice concentrations from the 89 GHz AMSR-E and
from the 85 GHz SSM/I data (shown below). The AMSR-E results are
preliminary because (1) AMSR-E is still in the calibration phase, (2)
they have been produced with the ASI algorithm fine tuned for for the SSM/I
frequencies, and (3) slight changes in the results are to be expecting
from adapting the ASI algorithm and the NASA TEAM algorithm (involved in
the ASI algorithm) fully to the AMSR(-E) frequencies.
When comparing the AMSR-E and SSM/I based sea ice images, the
most important differences are:
-
the finer resolution of the ice edge and ice concentration across the complete
image and
-
the spurious low ice concentrations near south east coast of Novaya Zemlya
and around Svalbard present in the SSM/I based image are strongly reduced
in the AMSR-E image. These spurious ice concentrations are attributed
to atmospheric influence ('weather effects'). They are present to a much
smaller extent in the ASMR-E image. This is mainly explained with its 19.35
GHz channel which are much closer to the 22.235 GHz water vapor absorption
line than the corresponding channels of AMSR(-E) (19 GHz).
Images from the Moderate-resolution Imaging Spectroradiometer (MODIS) onboard
the EOS Terra satellite are shown for comparison. The MODIS images are
at 1km resolution. The Channels 1(R), 3(G) and 4(B) are in the visible
range of the electromagnetic spectrum. Note that the MODIS images are not
in the same projection as the passive microwave data.
All data were recorded on 17 July 2002. Svalbard can be seen on the
left and Novaya Semlya on the right hand side of the images.
Conclusion
The AMSR-E is of particular importance for sea ice remote sensing. The
spatial resolution of the data is finer and the weather influence is lower.
The additional channels will allow the estimation of ice temperature and
snow depth over ice.
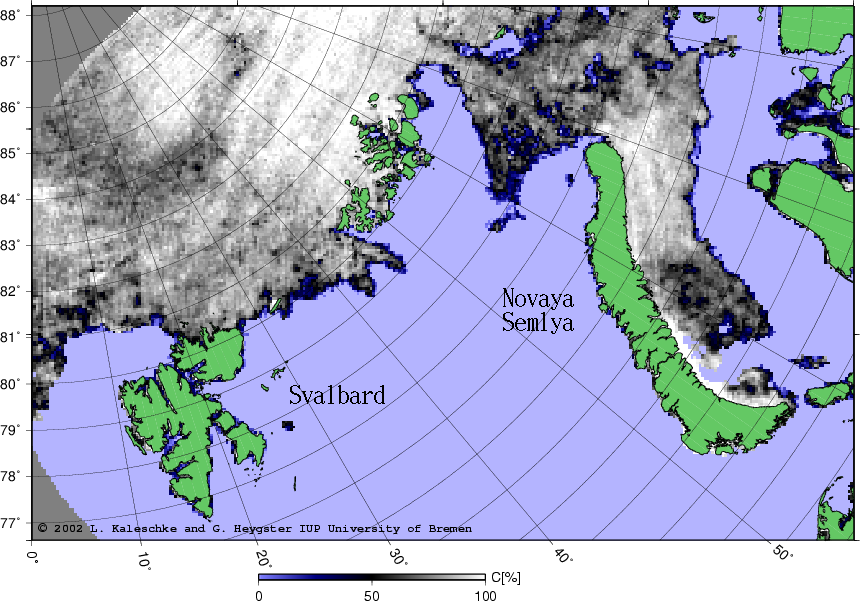 6.25 km Resolution Total Sea Ice Concentration
from AMSR-E 89 GHz.
6.25 km Resolution Total Sea Ice Concentration
from AMSR-E 89 GHz.
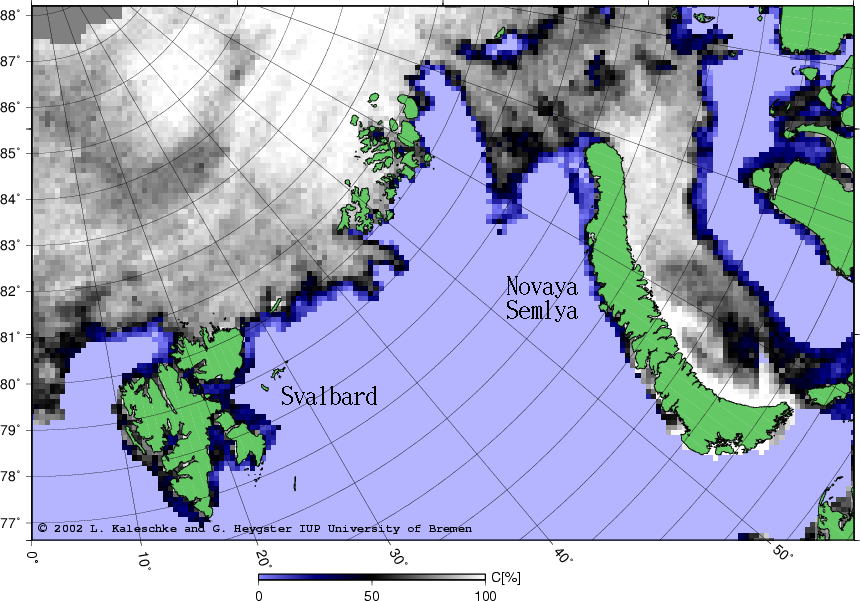
12.5 km Resolution Total Sea Ice Concentration from SSM/I 85 GHz.
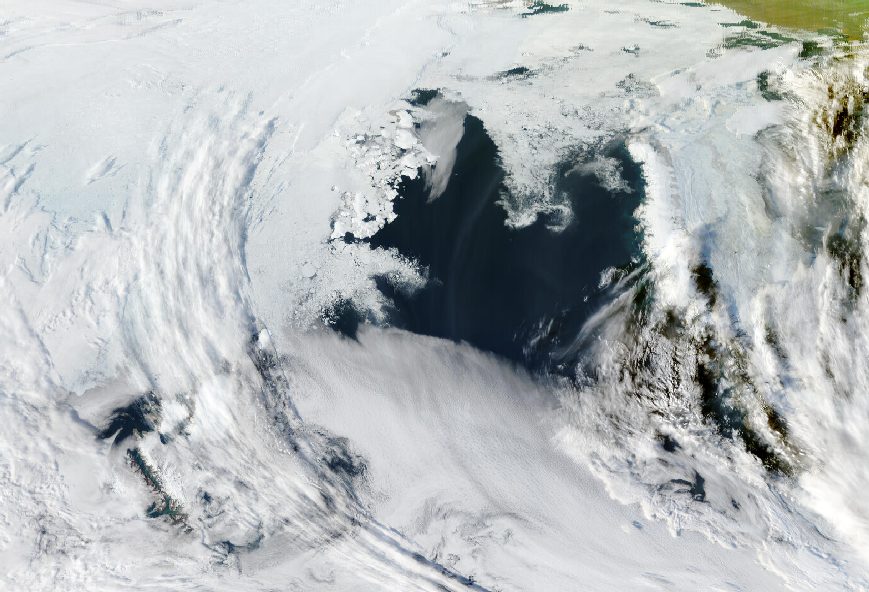
1 km Resolution MODIS Image. Channel 1-3-4.
In future, the AMSR(-E) data will be distributed in two way:
-
by the NASDA Earth Observation Center (EOC).
EOC will distribute both AMSR and AMSR-E data.
-
by the National Snow and Ice Data Center (NSIDC).
The priliminary AMSR-E data have been provided by the National
Space Development Agency of Japan as part of a cooperation agreement
with the University of Bremen, PI Georg Heygster.
The SSM/I data have provided by the GHRC
MODIS images have been obtained from
rapidfire.sci.gsfc.nasa.gov.