Observations of chlorine monoxide (ClO) have been performed at Spitsbergen throughout winter and spring 1997 using the millimeter wave Radiometer for Atmospheric Measurements (RAM) of the University of Bremen. Spitsbergen was located well inside the polar vortex with periods of very low stratospheric temperatures over Ny-Ålesund (78.9°N/11.9°E). Low stratospheric temperatures are a neccessary condition for polar stratospheric clouds (PSC) to occur, which can entail chlorine activation. Because ClO measurements require low tropospheric water vapor the rather poor weather conditions limited successful observing periods to approximately 8 days. Data from these days show enhanced lower stratospheric ClO mixing ratios of up to 1.9 ppbv during daytime.
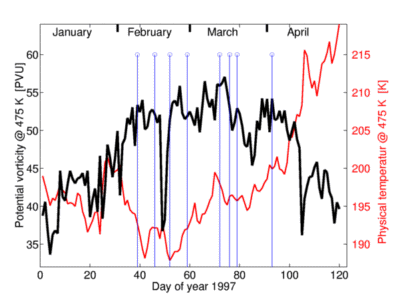
Figure 1. Potential vorticity in PVU and temperature in Kelvin at the 475 K isentropic level above Ny- Ĺlesund. Data are from ECMWF. The circles indicate days with RAM measurements that were processed with the scaling factor method described later in this poster. Chlorine activation is caused by heterogeneous chemical processes on polar stratospheric clouds with subsequent denitrification and/or dehydration inside the polar vortex. Once Nitrogen compounds disappeared ClO and the dimer Cl2O2 exist as long as temperatures in- side the vortex are sufficiently low. The potential vorticity at the 475 K isentropic level presented in fig. 3 shows that Ny-Ĺlesund was located well inside the polar vortex almost all the time from February to mid April with temperatures low enough for the formation of PSC in March.
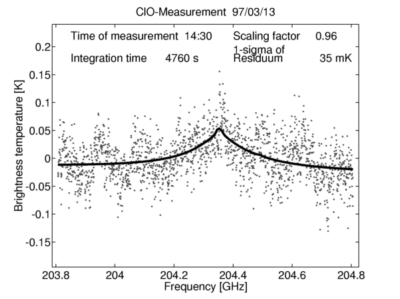
Figure 2. A typical daytime minus nighttime difference spectrum of the ClO measurements of March 13. The integration time is appr. 4760 s. The solid line shows a fit of a model spectrum to the measurement.
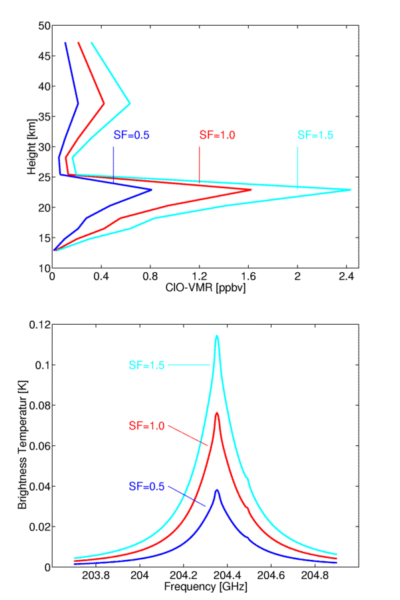
Figure 3. Top: the model profile (solid) and two examples of scaled profils. Bottom: the corresponding spectra from radiative transfer calculations.
The measurements performed by the mm-wave radiometer RAM were limited by the strong influence of tropospheric water vapor. Using the beam switch method minimizes instrumental effects. Differencing of daytime and nighttime spectra reduces baseline effects assuming just a small amount of ClO remaining in the lower stratosphere during the night. The difference spectrum therefore gives the slightly reduced ClO signal of the daytime measurement. This procedure is feasible because of all emitting species in the observed frequency range ClO only has a significant diurnal cycle. At night ClO is almost completely converted to its dimer. The remaining ClO during night time that is not converted to the dimer is included in all spectra to the same extent.
In a situation of disturbed stratospheric chemistry most of the ClO content is concentrated in a layer around an altitude of appr. 20 km (Fig. 2). A model spectrum was obtained using a given ClO distribution in a radiative transfer calculation. Since radiative transfer is an almost linear process for stratospheric ClO, the scaling of the model spectrum to the measured daytime minus nighttime difference spectra enables us to estimate the ClO VMR at around 20 km of altitude.
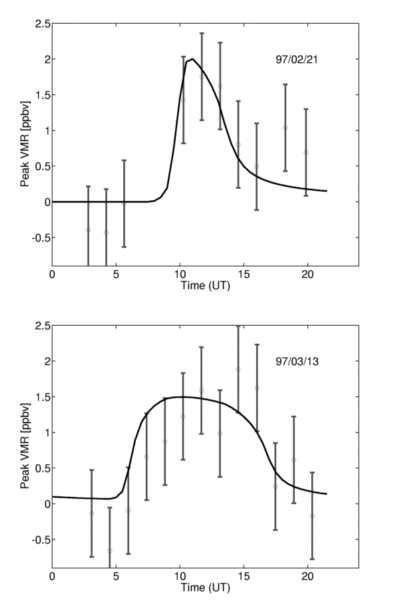
The evolution of the ClO VMR for two days obtained by the scaling factor method is shown in fig. 4. Along with the ClO measurements a modeled diurnal cycle of ClO is presented in the figure. The error in the calculated scaling factors due to noise and baseline effects is ~10%. The ClO VMR retrieved from the measurements clearly show a diurnal variation following sunrise and sunset in the stratosphere. The vortex during winter 1997 being cold and stable above Ny-Ålesund has experienced a chlorine activation with a maximum ClO value of around 1.9 ppbv. ClO VMR retrieved from simultaneous measurements performed by other microwave instruments ([1][2][4]) also show high ClO VMR. The high values detected on 7 days throughout the winter that are presented in fig. 5 (with calculated column densities) indicate a rather strong chemical depletion of lower stratospheric ozone above Ny-Ålesund.
Figure 4. Two sets of measurements from February 21 and March 13, showing diurnal variation of the ClO-peak VMR calculated with the scaling factor method. This is confirmed by the ozone evolution observed by the RAM showing a decrease of about 30% at the 475 K isentropic level [3]. The ozone depletion started mid February when ClO values were high and sunrise occured in the lower stratosphere.
This work has been supported by the Alfred-Wegener-Institute for Polar and Marine Research, the German Ozone Research Program and the Environment and Climate Program of the European Community. We thank Jens Warming for his technical support in Ny-Ĺlesund. We also thank David Lary for the AUTOCHEM ClO calculations.