
The AMSR-E instrument has not produced data since Oct 4, 2011. Therefore, the sea ice maps on this page cannot be updated.
The new satellite しずく "Shizuku" (GCOM-W1) that carries AMSR2 (the successor of AMSR-E) has been launched successfully on May 18, 2012. . It has been delivering data since August 2012. On Januray 25, 2013, the calibrated brightness temperature data have been released to the public, and starting from 26 January 2013, we produce daily sea ice concentration maps from the AMSR2 data.
To bridge the gap between AMSR-E and AMSR2, we offer a provisional service based on SSMIS data (In the case you have difficulties reaching this page, please check with your system administrator that you are allowed to use port 8084.) These maps have lower resolution, but for compatibility reasons, they are offered at the same grid spacing as the AMSR-E based maps of this site.
![]()
This page presents the AMSR-E sea ice concentrations calculated daily in near real time. The service is part of the GMES project Polar View and of the Arctic Regional Ocean Observing System (Arctic ROOS).
The research for developing, validating and improving the retrieval algorithms was done within the EU Integrated Project DAMOCLES (Developing Arctic Modeling and Observing Capabilites for Long-term Environmental Studies)
The ASI sea ice concentration algorithm used here has been
validated in
several studies (Spreen et al. 2005,
Spreen
et al., 2008).
However, no warranty is given for the data presented
on these pages.
Please help maintaining this service by properly
citing and
acknowledging if you use the data for publications:
Spreen, G., L. Kaleschke, and G.Heygster(2008), Sea
ice remote sensing using AMSR-E 89 GHz channels
J. Geophys. Res.,vol. 113, C02S03,
doi:10.1029/2005JC003384.
Other products updated regularly
A new historic Arctic sea ice minimum has been reached on 8 September, 2011. For details, see the updated press release of the University of Bremen.
Note that at the end of August 2012, the sea ice extent fell below the 2007 and 2011 minima!
| More selected regions |
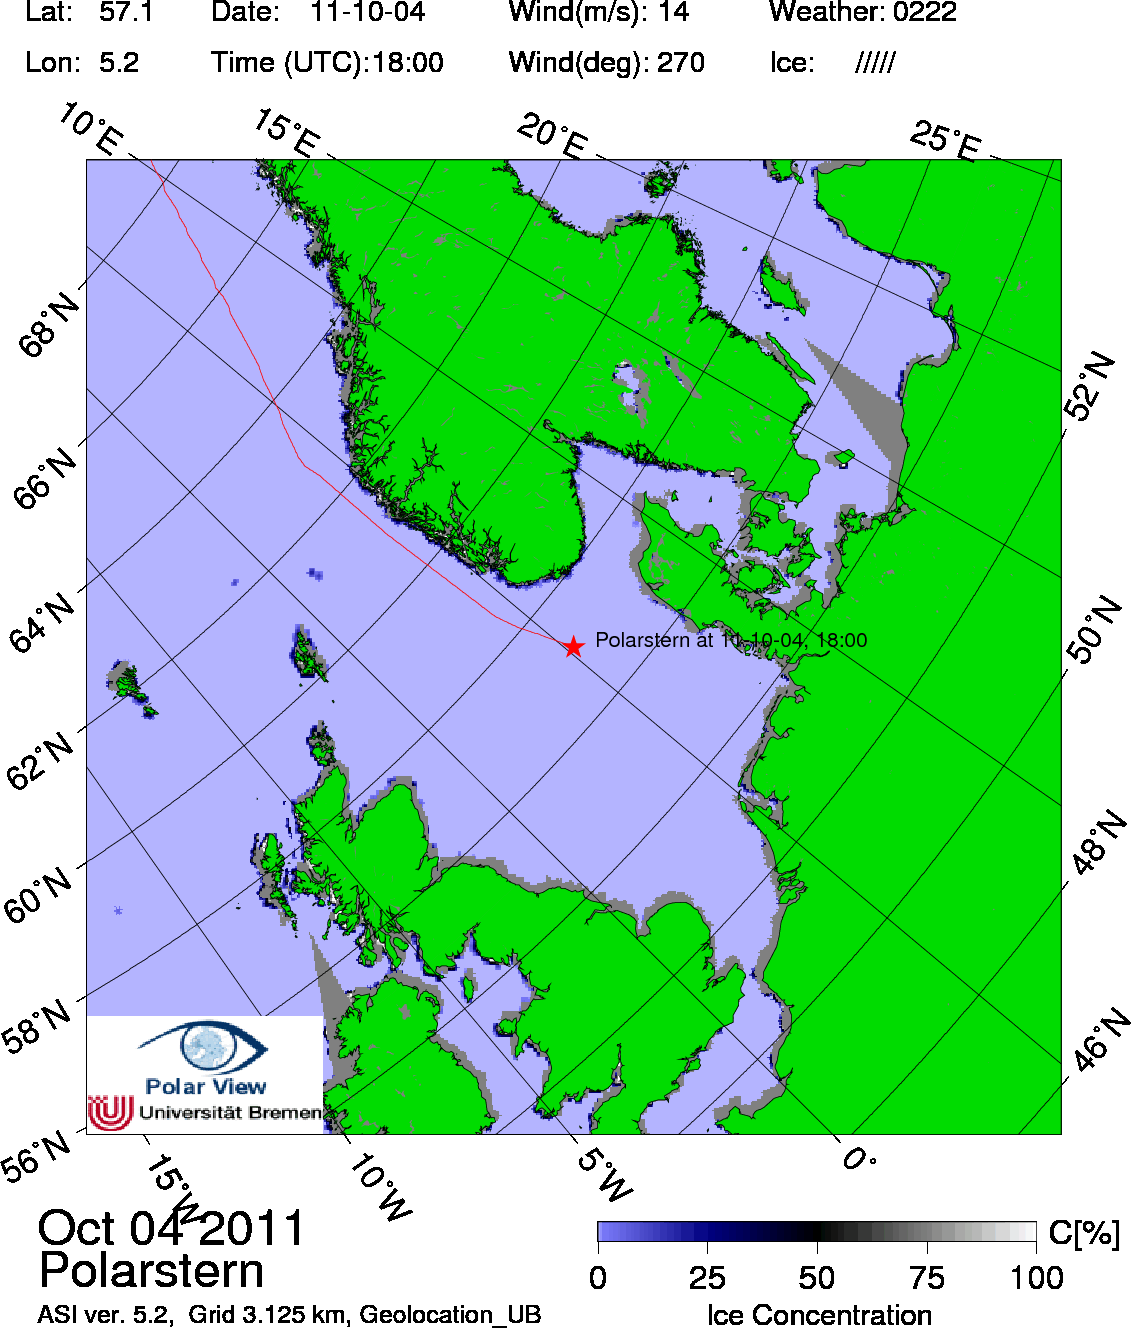
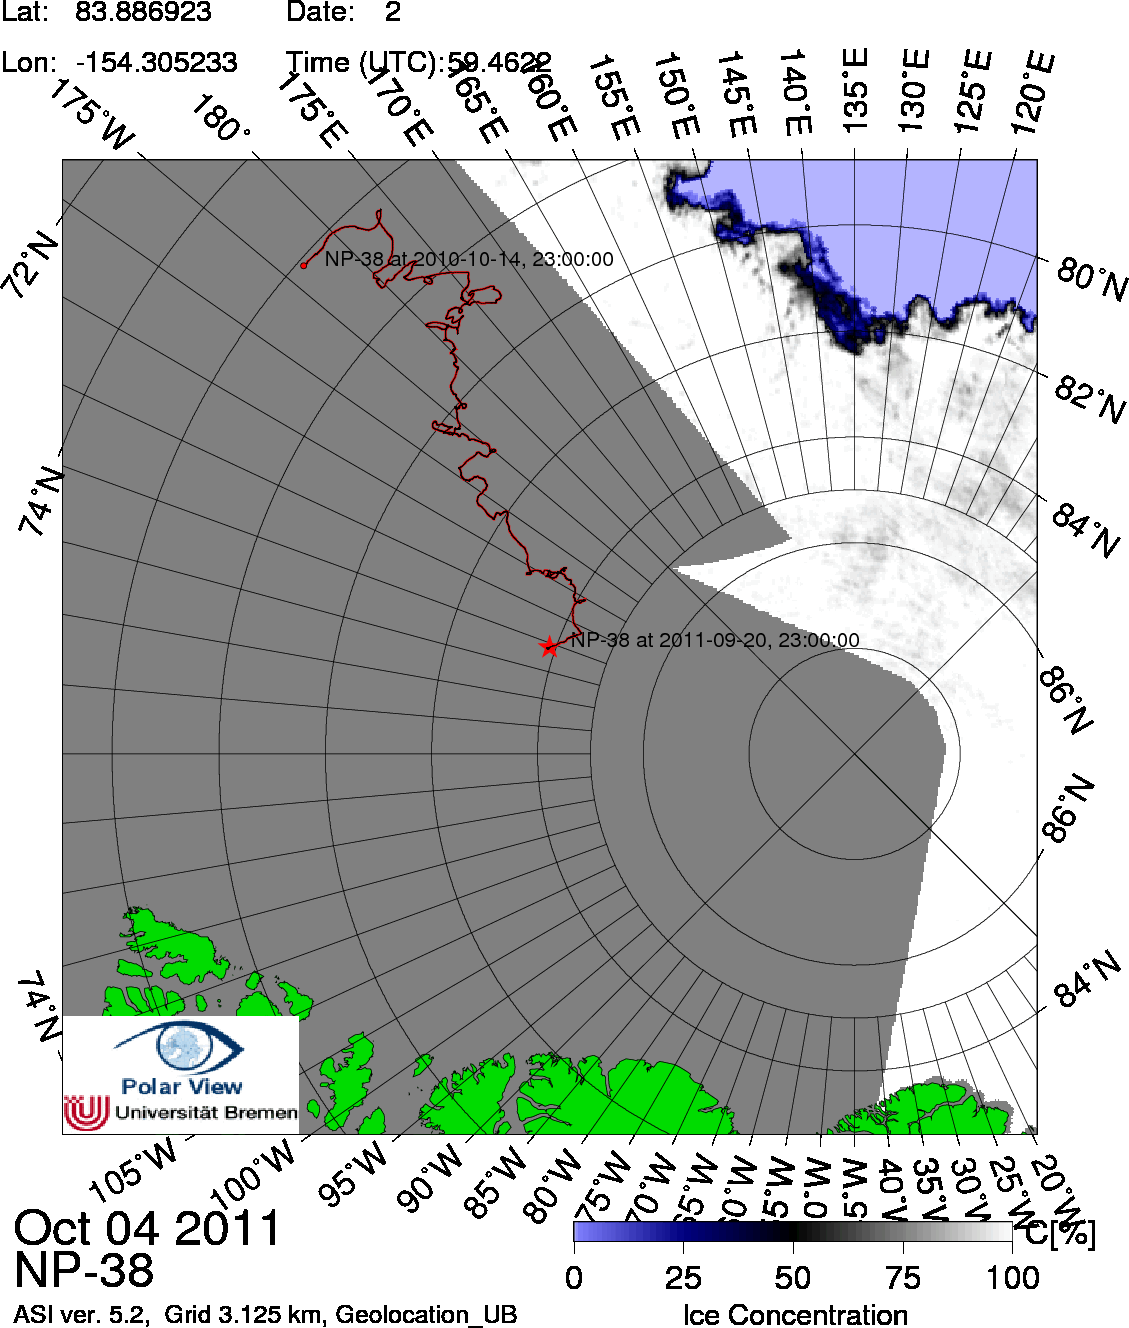
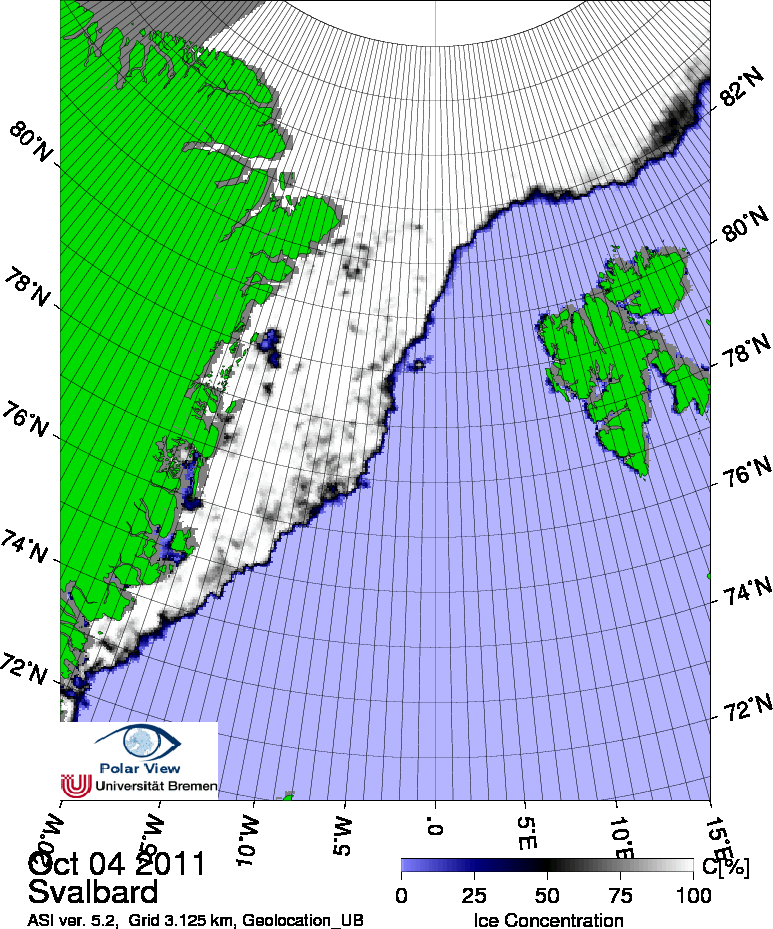
 Click on the image to enlarge (~1.2 MB). Sea ice map calculated from AMSR-E data using the ARTIST sea ice algorithm (ASI 5). |
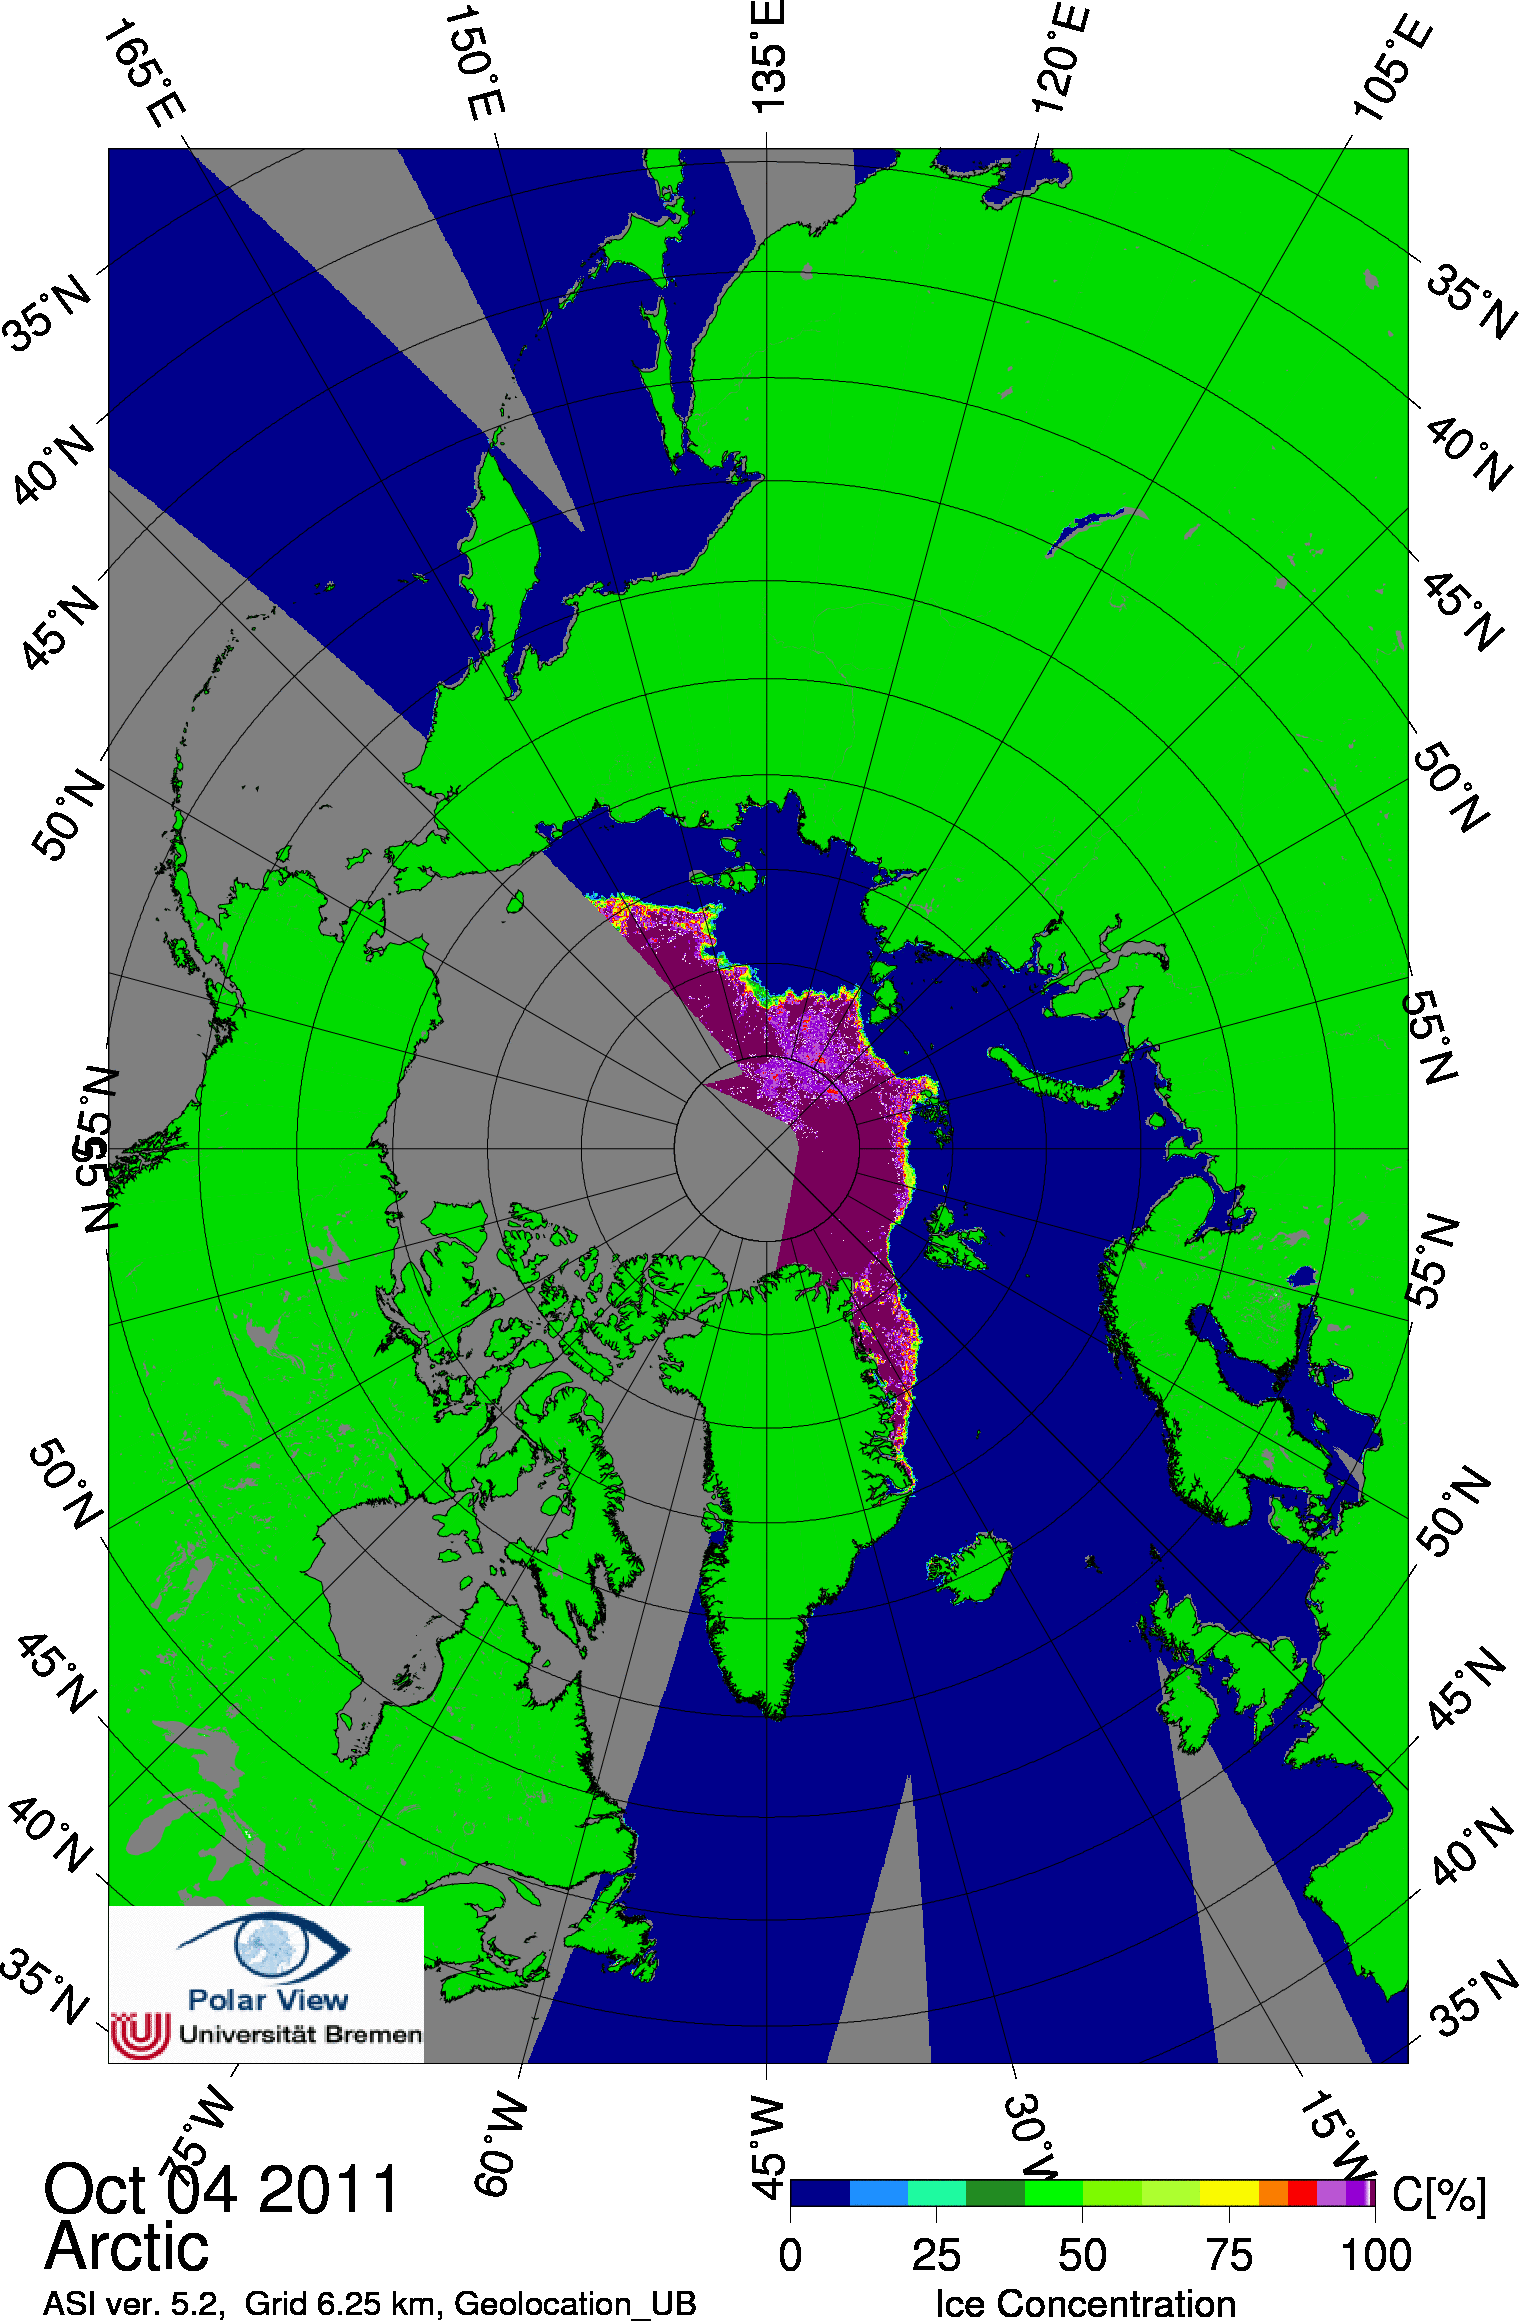
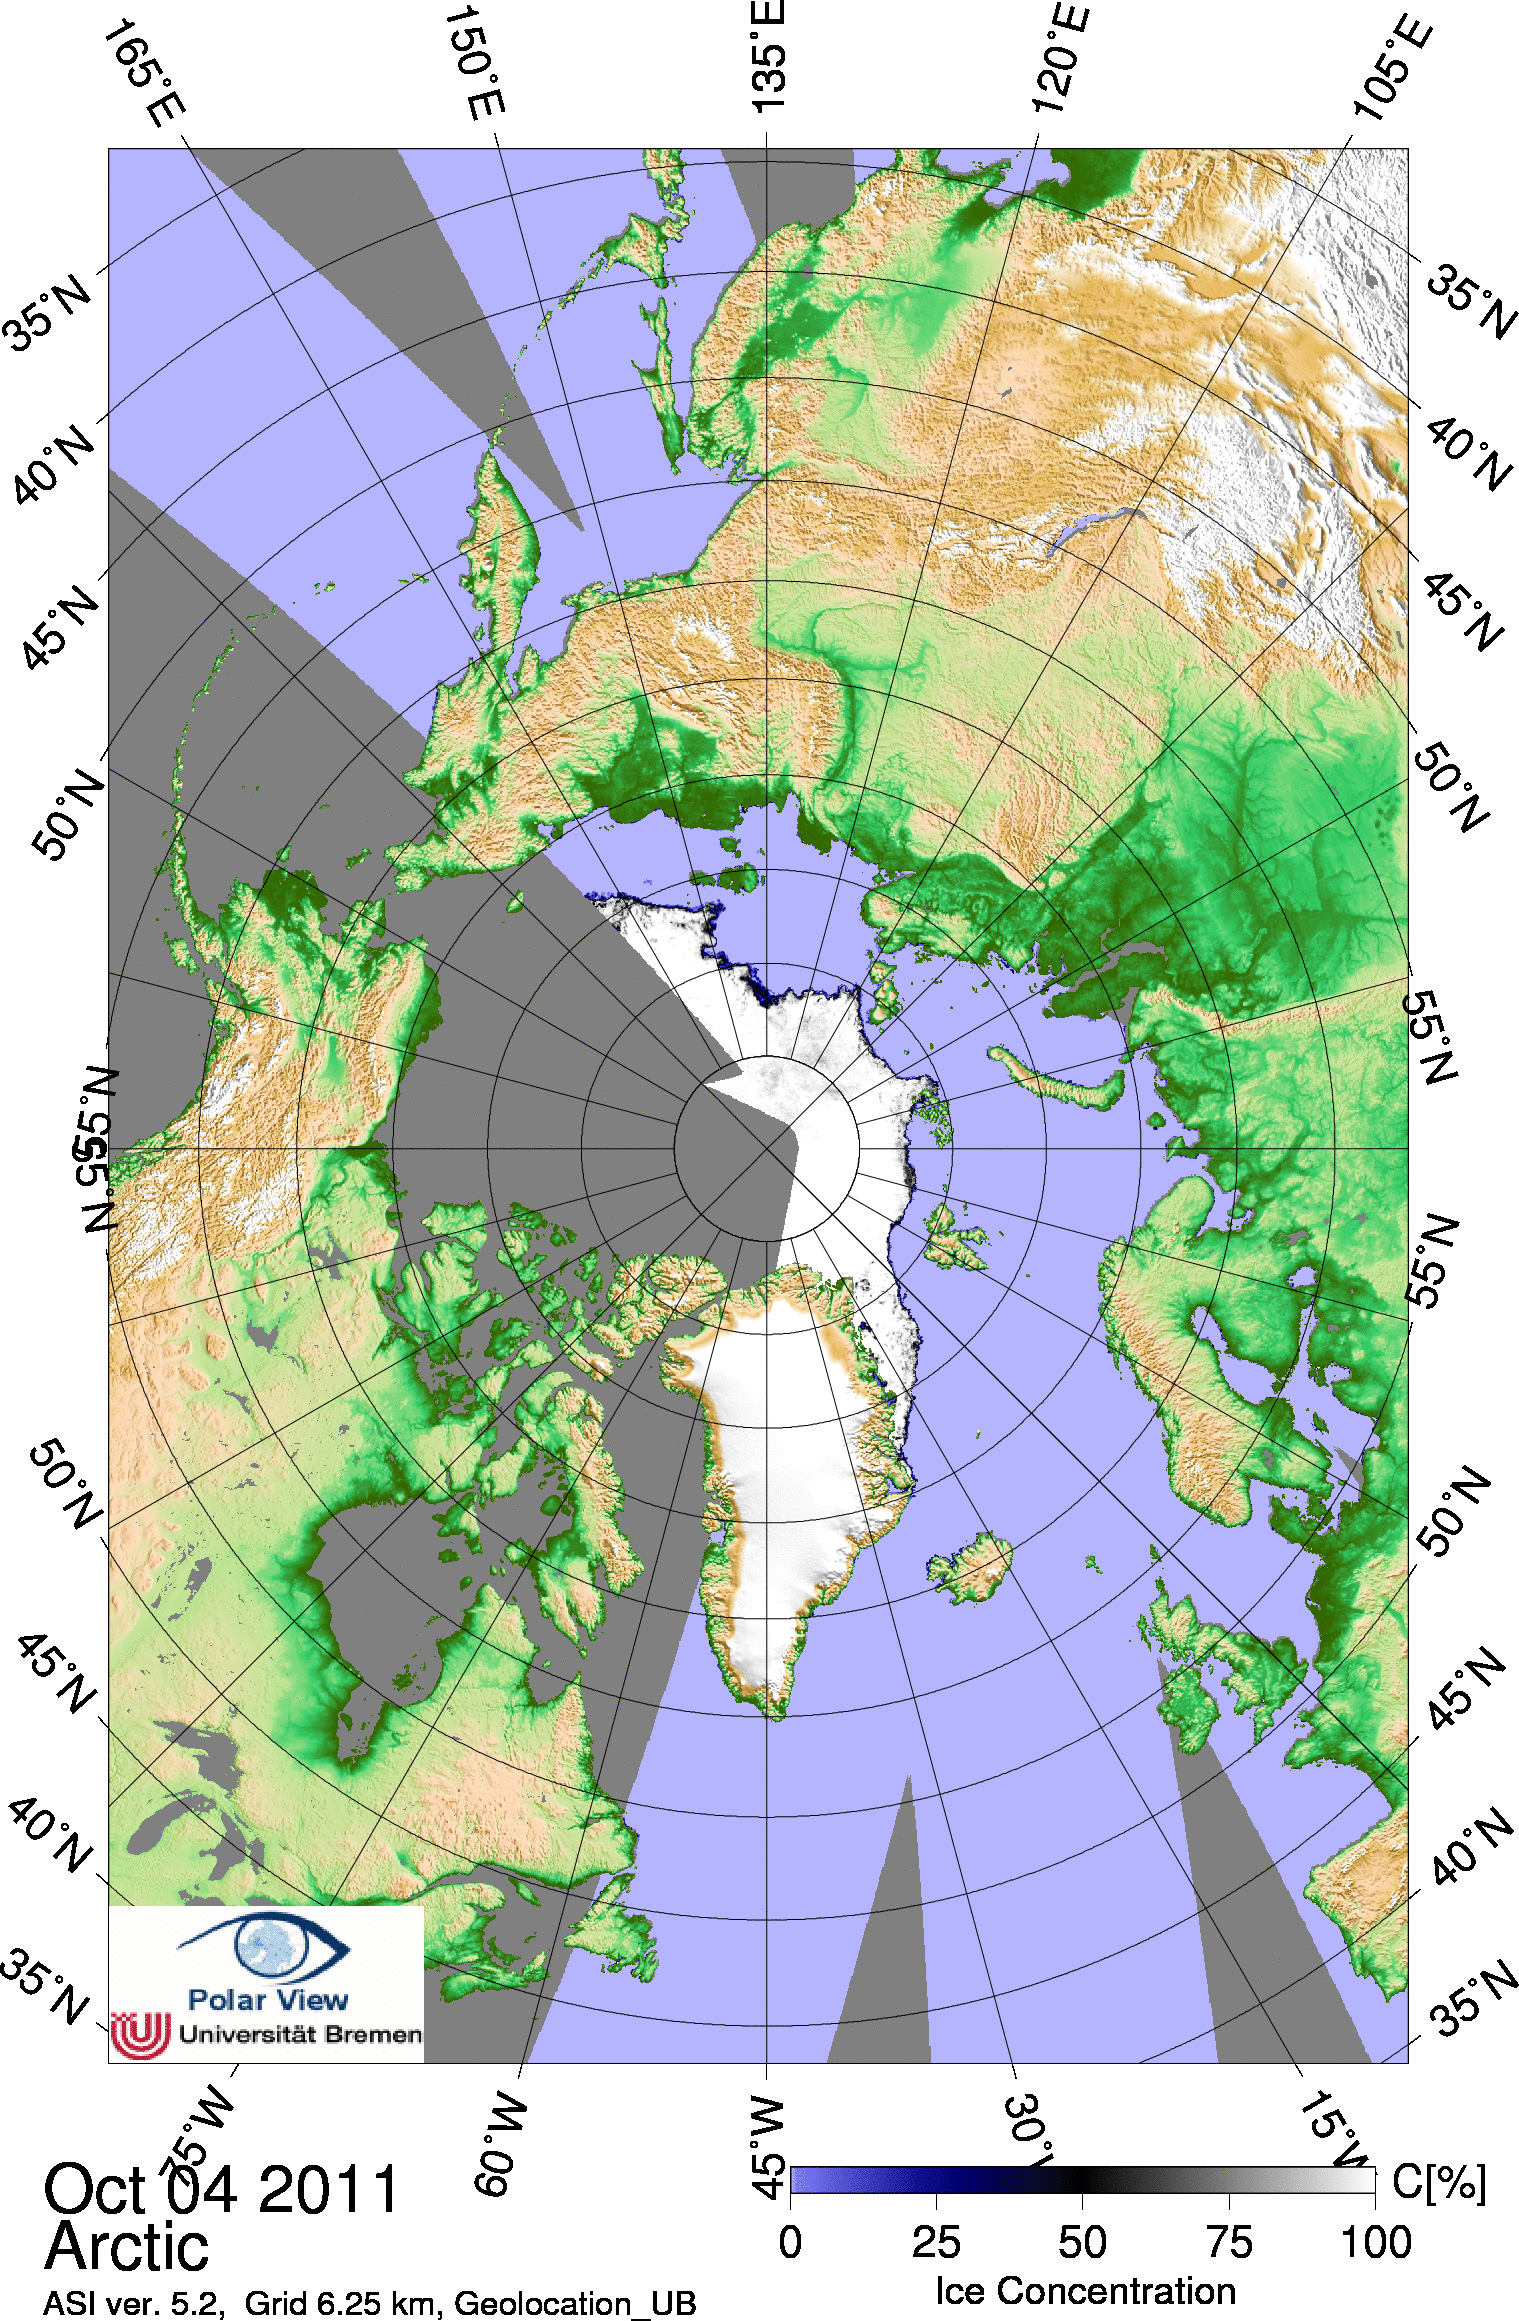
Click on the image to enlarge (~500 KB). False color sea ice map. |
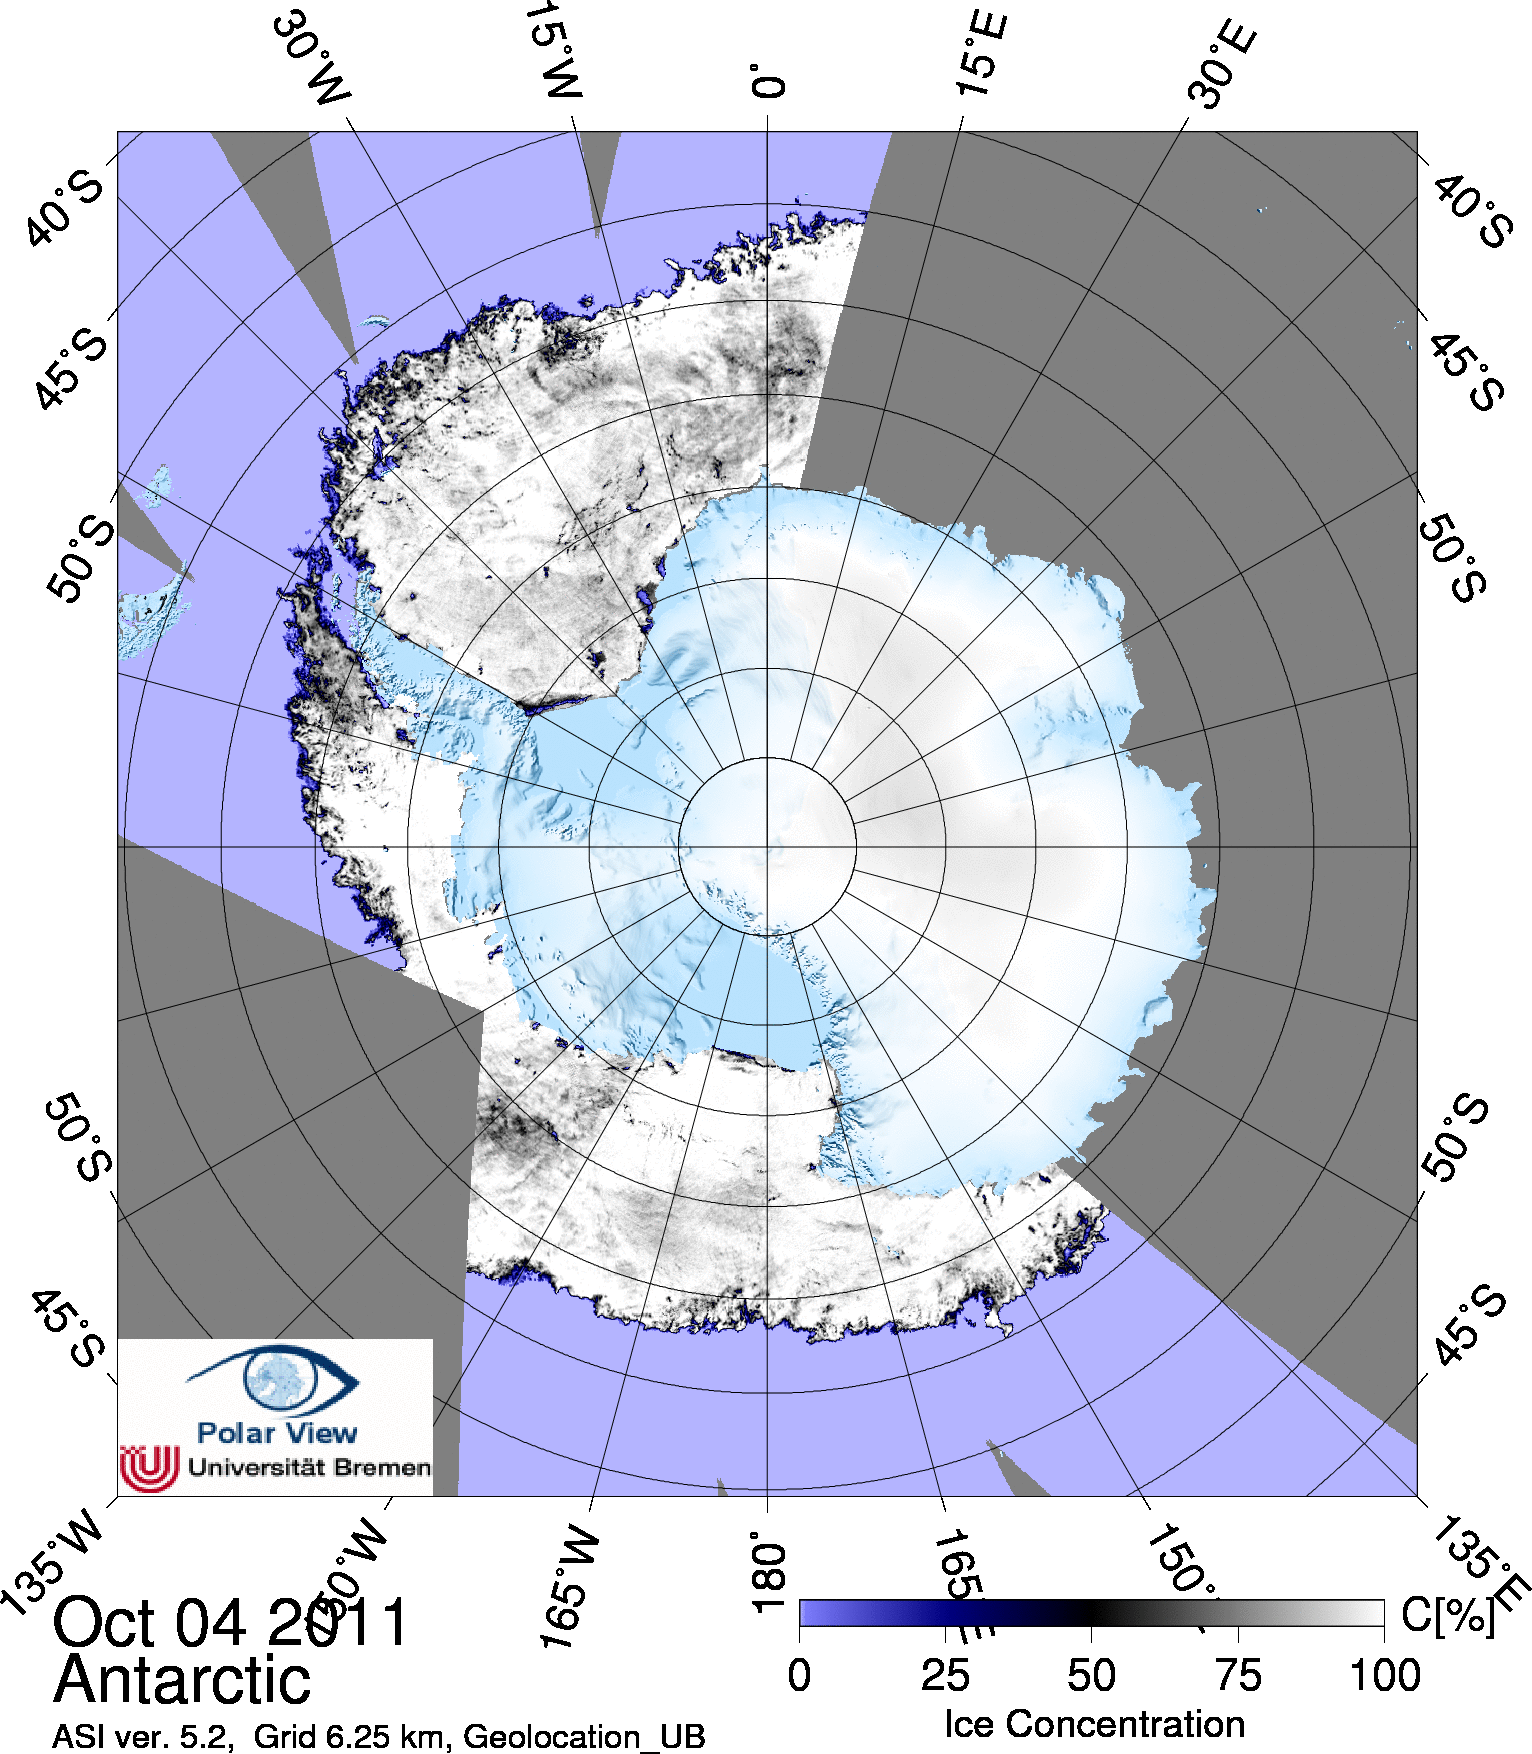 Click on the image to enlarge (~500 KB). Sea ice map calculated from AMSR-E data using the ARTIST sea ice algorithm (ASI 5). |
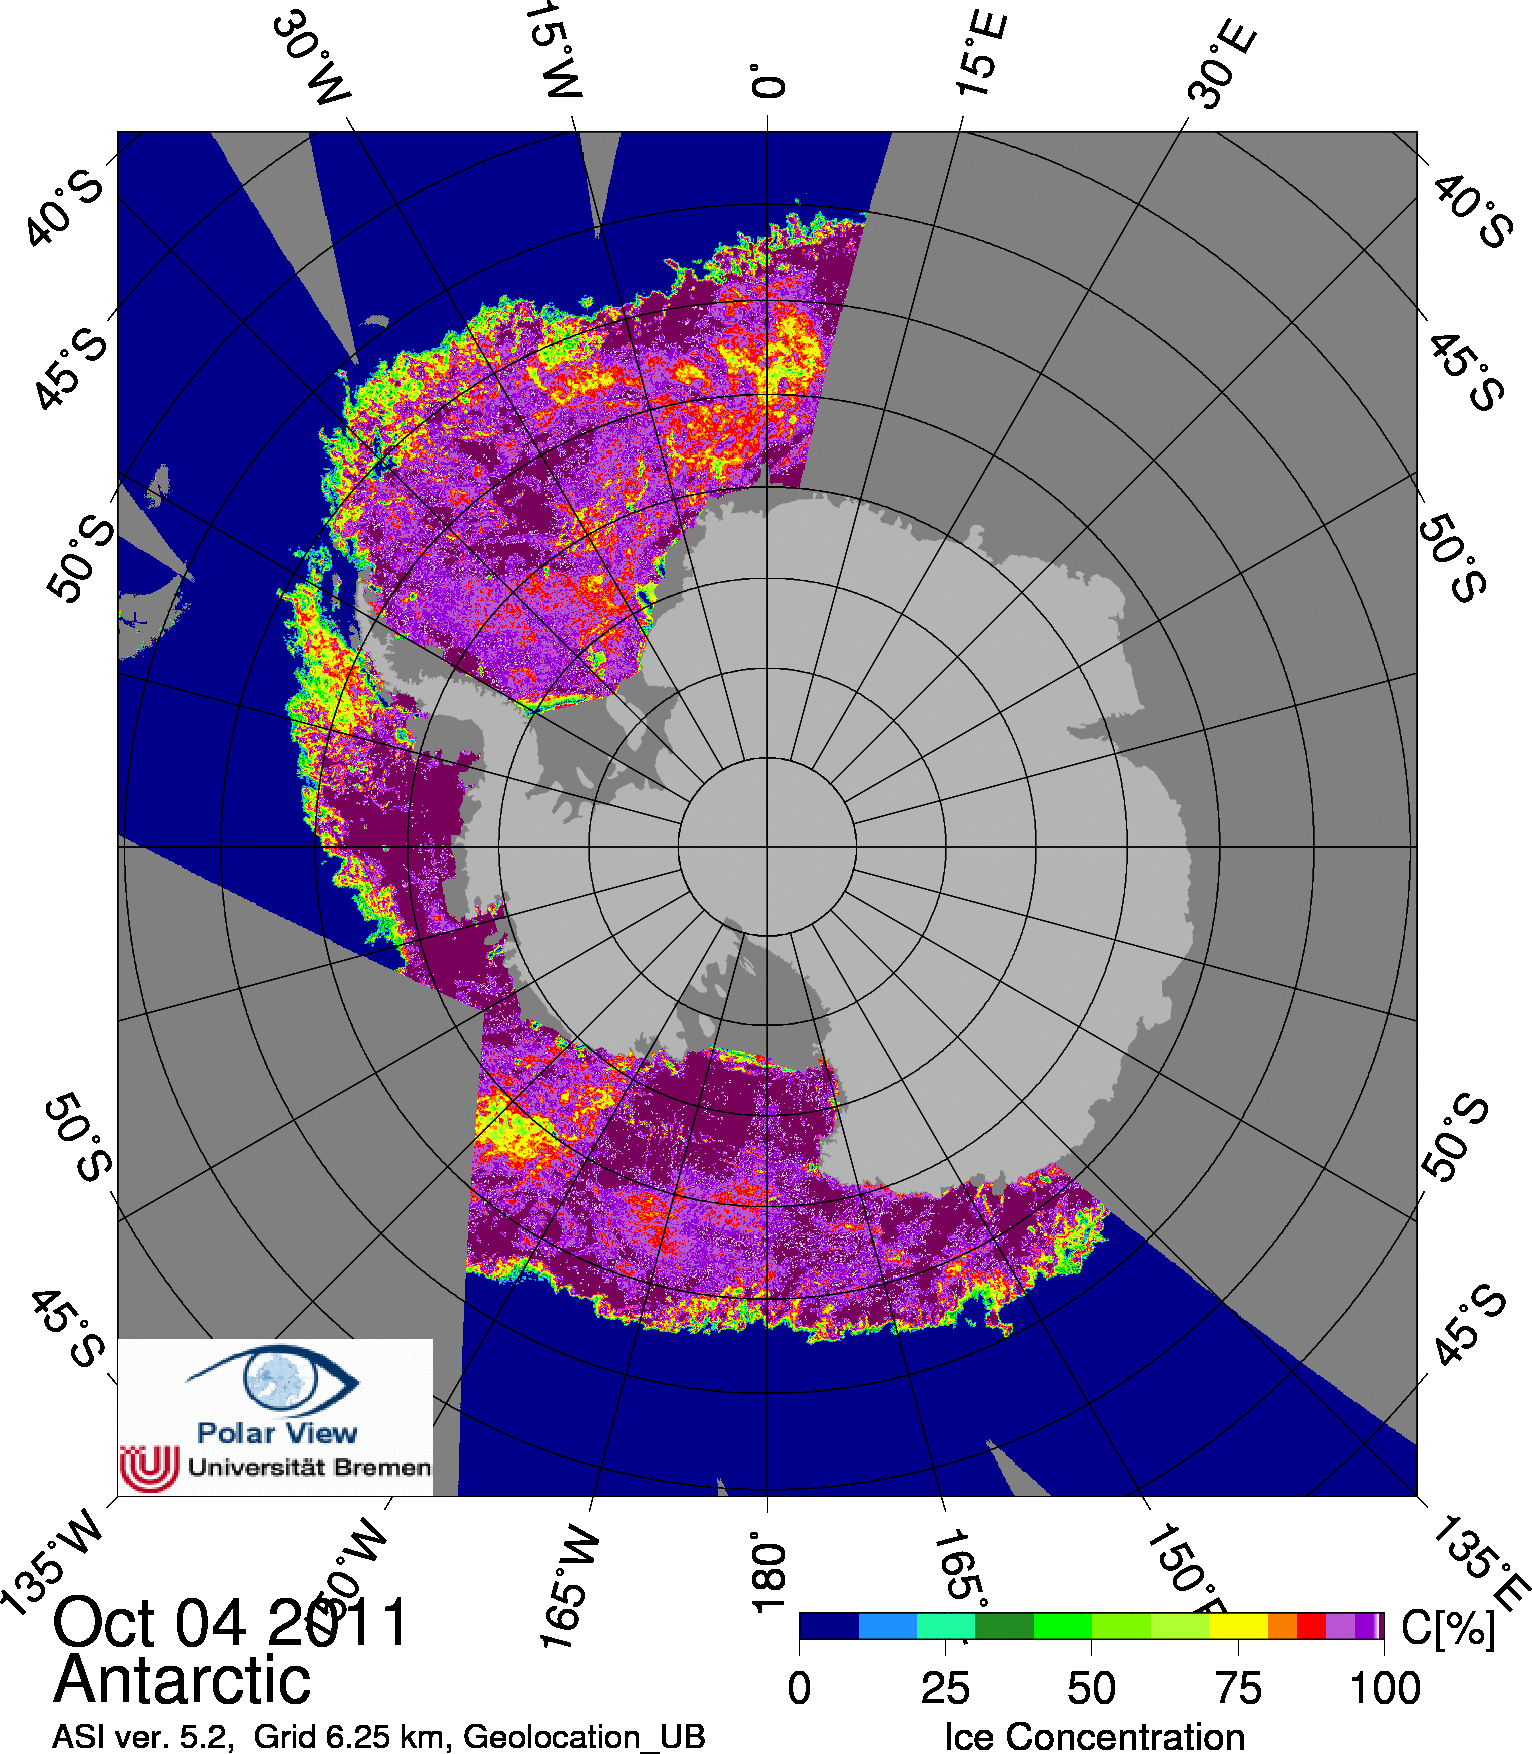 Click on the image to enlarge (~300 KB). False color sea ice map. |
| GEOTIFF | Arctic Antarctic Geotiff ReadMe |
| HDF | Arctic Antarctic |
| grid coordinates (HDF) | Arctic Antarctic |
See the continued time series, updated with SSMIS-based sea ice data, on the SSMIS page
| |
|
Animation of
Arctic sea ice concentration (daily update of the last 21 days; AVI format, ~ 1 MB) |
Animation of Antarctic sea ice concentration (daily update of the last 21 days; AVI format, ~ 1 MB ) |
|
Animation of Arctic sea ice concentration (Jan 2003 to Oct 2011; AVI format, ~ 34 MB) |
Animation of Antarctic sea ice concentration (Jan 2003 to Oct 2011; AVI format, ~ 31 MB) |
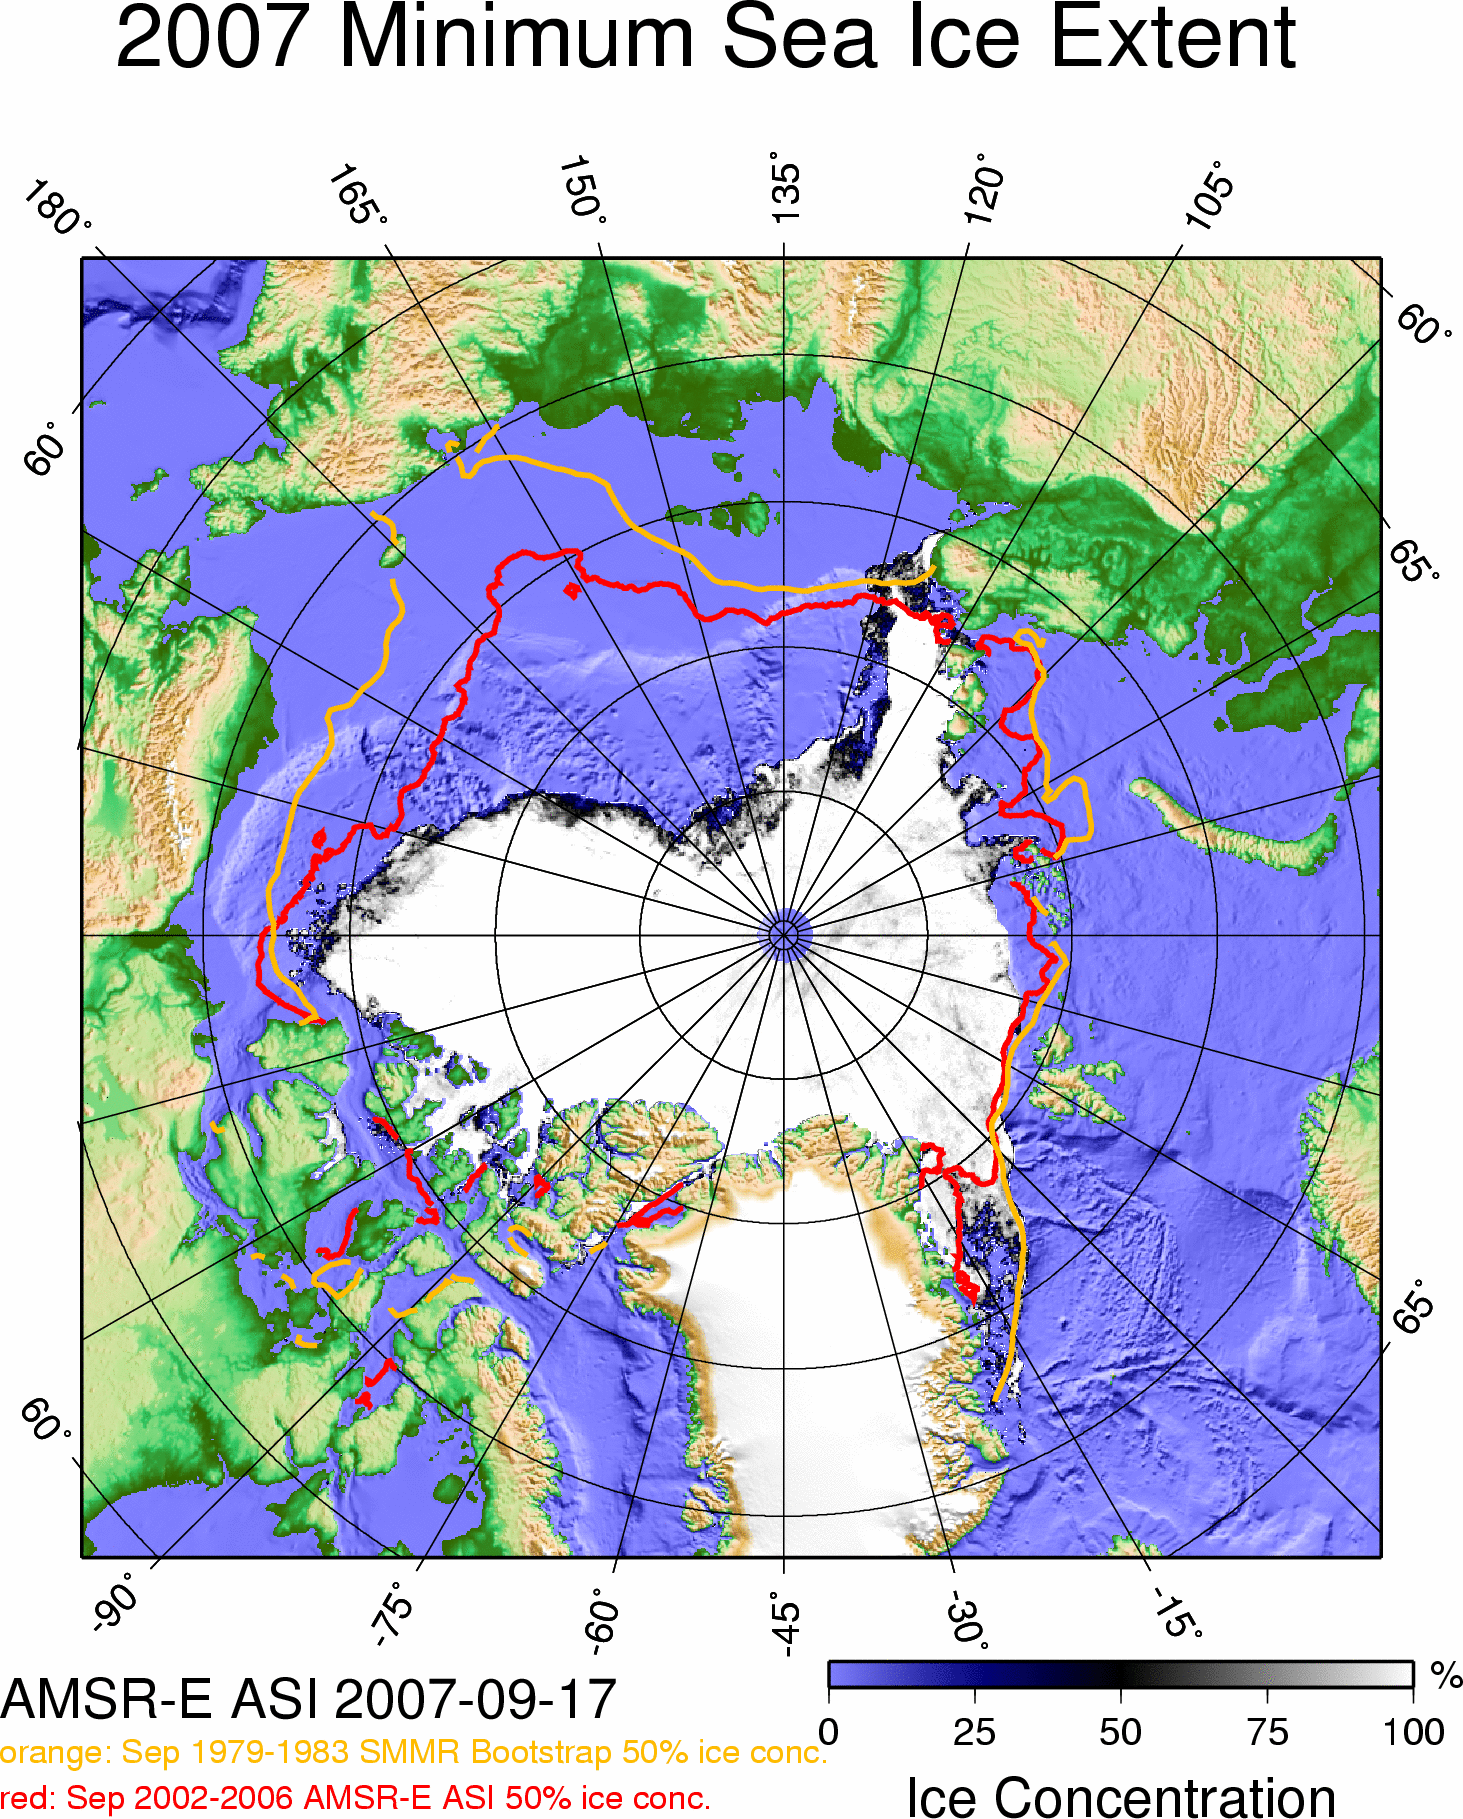
2007 minimum sea ice extent and mean September 2002-2006 and September 1979-1983 sea ice extents.
All level 1A data are received from the National Space Development Agency of Japan.
Distributed by: National Snow and Ice Data Center, Boulder, CO, USA. FTP download.
The position of the German research vessel Polarstern is provided by the Alfred-Wegener-Institut, Bremerhaven, Germany.
No warranty, expressed or implied, is made regarding the accuracy or utility of the data! False ice concentrations can occur due to bad weather systems.