GOME Page
 IUP/ife Homepage
|
GOME Page
IUP/ife Homepage
|
|
|
|
|
GOME Solar Activity Observations |
|
|
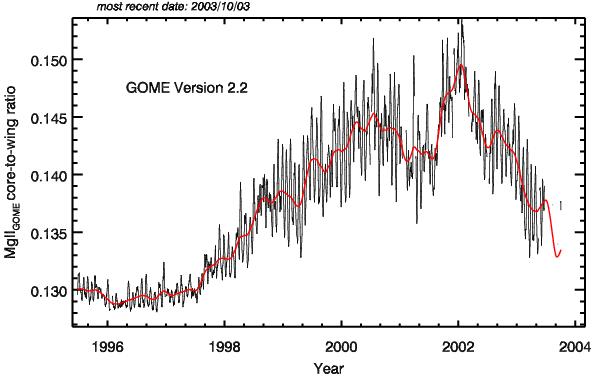
The Mg II doublet exhibits the largest solar irradiance variation in the GOME spectral range (240 nm - 790 nm) and is therefore best suited to be used as a proxy solar activity proxy indicator for UV solar flux variability associated with the 11-yr solar cycle (22-yr magnetic cycle) as shown in Figure 1. |
|
|
Figure 1. GOME MgII core-to-wing ratio. |
|
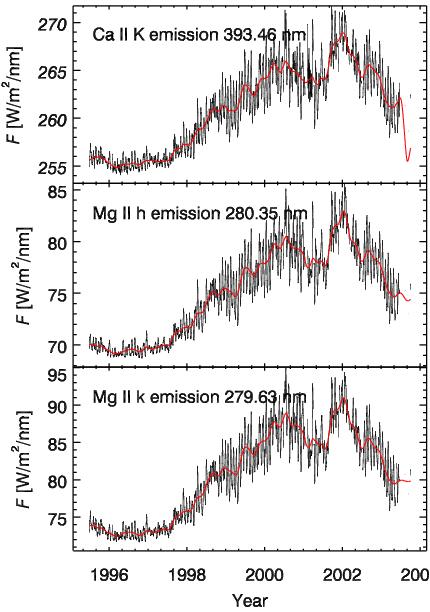
The variation of the MgII index is similar to that of the sunspot number and other solar indices. The MgII h and k doublet are absorption features centred at 279.9nm, which originate in the photosphere. During phases of high solar activity an increase in the number of sunspots in the photosphere and large chromospheric plage areas are observed. The plage areas are hotter than the surrounding areas and cause the enhancement of the emission core within the absorption features of many solar Fraunhofer lines (see Figure 2). |
|
|
|
Figure 2. Solar irradiance in the line center of
selected Fraunhofer lines. |
|
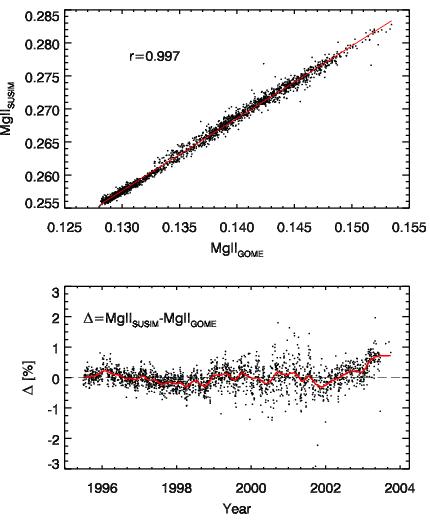
The daily solar observations from GOME permit the calculation of a longterm time series of the Mg-II index. The advantage of calculating a core-to-wing ratio, which defines the MgII index, rather than the absolute solar irradiance of the line center, as shown in Fig. 2, is that the former is less sensitive to instrumental errors, for instance, UV degradation with time. GOME was launched in April 1995 during solar minimum following solar cycle 22 and is now observing the onset of solar cycle 23. The modulation of the Mg II index associated with the solar rotation (ca. 27 days disc average) can be also observed. This effect is similar to that of the light house (light coming in and out) since active regions move in and out of the field-of-view of the satellite (and earth). The GOME time series has been smoothed using twice a 55-day boxcar, which filters out the rotational modulation (27 day, 13.5 day, etc.), and is also shown as red solid lines in Figs. 1 and 2 Since the absolute values of the MgII index vary depending on the instrumental slit width (spectral resolution) and the definition of the core-to-wing ratio, the achievement of a high correlation between time series derived from different instruments is important in establishing a longterm record exceeding the lifetime of a single space instrument and covering several solar cycles (Cebula and DeLand, 1998). Figure 3 shows the correlation between GOME Version 2.0 and the SUSIM/UARS MgII index Version 19r3. |
|
|
Figure 3. Top: Correlation plot of GOME Ver. 2.0 and SUSIM
Ver. 19r3. |
|
Figure 4 depicts a longterm MgII index time series spanning more than two solar cycles (solar cycle 21 to 23), which has been constructed from the SBUV/SBUV2 series on Nimbus7, NOAA9, and NOAA11 (NOA: Viereck and Puga, 1999) and SUSIM/UARS (SUS: Floyd et al. 1998) and GOME/ERS time series (GOM) by scaling each time series to the GOME value range by successive linear regressions (deLand and Cebula 1993, Viereck and Puga, 1999, Weber 1999). |
|
|
|
Figure 4. Composite GOME MgII Index.
|
|
Longterm time series of solar activity indicators have been successfully correlated with and linked to atmospheric ozone variations and other relevant atmospheric quantities such as monthly cloud cover. For further details on the GOME solar indices, particularly the definition of the GOME MgII index, the reader is referred to Weber et al. (1998,1999). Other instruments currently producing Mg II index data are SUSIM (Floyd et al., 1998) and SOLSTICE (de Toma et al., 1997) aboard UARS. The composite MgII index derived from the NOAA, SUSIM, and GOME index is also available online. References: Cebula, R.P., and M.T. DeLand, 1998: Comparisons of the NOAA11 SBUV/2, UARS SOLSTICE, and UARS SUSIM MgII solar activity proxy indices , Sol. Phys. 177, 117-132; DeLand, M.T., and R. P. Cebula, 1998: Solar UV activity at solar cycle 21 and 22 minimum from NOAA 9 SBUV2 data, Sol. Phys. 177, 105-116. DeLand, M.T., and R. P. Cebula, 1993: Composite MgII solar activity index for solar cycles 21 and 22, J. Geophys. Res. 98, 12809-12823. de Toma, G., et al., 1997: Mg II core-to-wing index: Comparison of SBUV and SOLSTICE time series, J. Geophys. Res. 102, 2597-2610. Floyd, L.E., et al., 1998: Solar cycle 22 UV spectral irradiance variability, Sol. Phys. 177, 79-87. Viereck, R.A., and L.C. Puga, 1999: The NOAA Mg II core-to-wing solar index: Construction of a 20-year time series of chromospheric variability from multiple satellites, J. Geophys. Res. 104, 9995-10005. Weber, M., J.P. Burrows, and R.P. Cebula, 1998: GOME Solar UV/VIS Irradiance Measurements between 1995 and 1997 - First Results on Proxy Solar Activity Studies, Sol. Phys. 177, 63-77. Weber, M., 1999: Solar activity during solar cycle 23 monitored by GOME, Proc. European Symposium on Atmospheric Measurements from Space (ESAMS'99), ESTEC, Noordwijk, The Netherlands, 18-22 January 1999, WPP-161, European Space Agency, p. 611-616. Current status on space weather
© 1997, written by
Mark Weber,
last change 2000/08/05. |
||||||||||||||||||||||||||