Regional Applications
Topographic Maps of the Wadden Sea from ERS-SAR Data
Jens Dannenberg*, Ralf Schmidt,
Georg Heygster
Founding: MARUM, Doktorandenkolleg Nordseeküste
The tidal flats of the Wadden Sea along the coast of northwest Germany are an worldwide unique ecosystem. The monitoring of this large and inaccessible arrea (appox.7300 km2) is very difficult. Its highly dynamic tidal zone whose topography changes on timescales from a few hours (storm events) up to several months (sediment ablations and disposal) requires a freqent update of topographic maps. Conventionally generated maps based on echo sounding and geodetic leveling techniques often do not represent the actual situation because it takes several years to map the complete Wadden Sea.
 With the help of remote
sensing data, which allow the monitoring of large areas, it is possible
to achieve a more frequent updating of the topographic maps of tidal areas
between high and low water level using the 'waterline method'. For
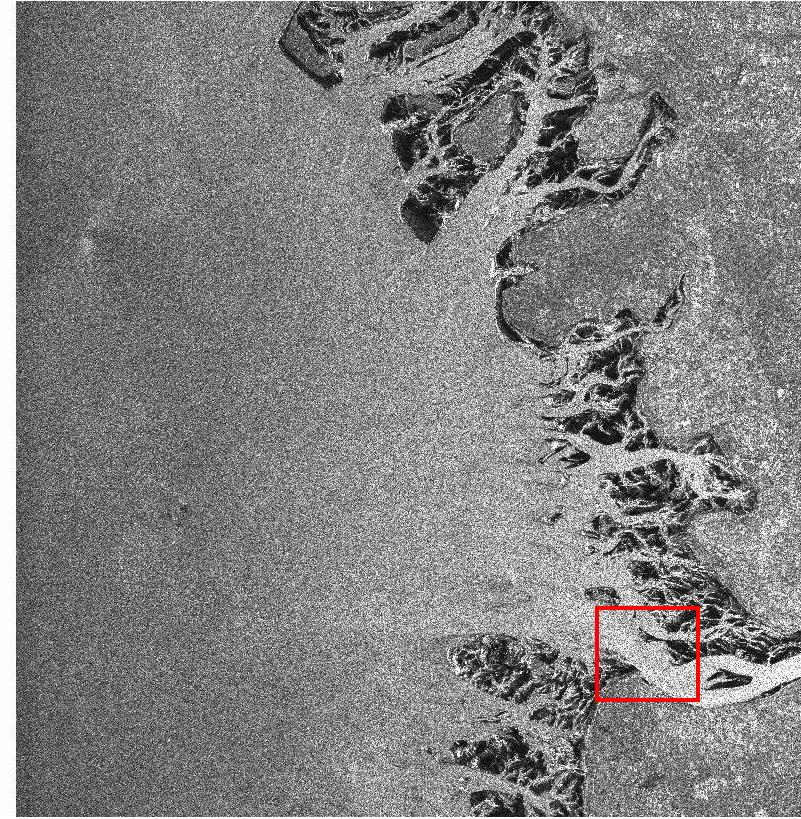
this study the images of the Synthetic Aperture Radar (SAR) sensor
aboard the European Remote Sensing Satellite ERS-2 are used. This
active sensor works independently of daylight and cloud coverage which is
important to get a sufficient number of utilizable images of the German
coast. A sample image (the coast of Schleswig-Holstein) is shown on the left.
The red box marks the location of the test area shown on the right hand.
With the help of remote
sensing data, which allow the monitoring of large areas, it is possible
to achieve a more frequent updating of the topographic maps of tidal areas
between high and low water level using the 'waterline method'. For
this study the images of the Synthetic Aperture Radar (SAR) sensor
aboard the European Remote Sensing Satellite ERS-2 are used. This
active sensor works independently of daylight and cloud coverage which is
important to get a sufficient number of utilizable images of the German
coast. A sample image (the coast of Schleswig-Holstein) is shown on the left.
The red box marks the location of the test area shown on the right hand.
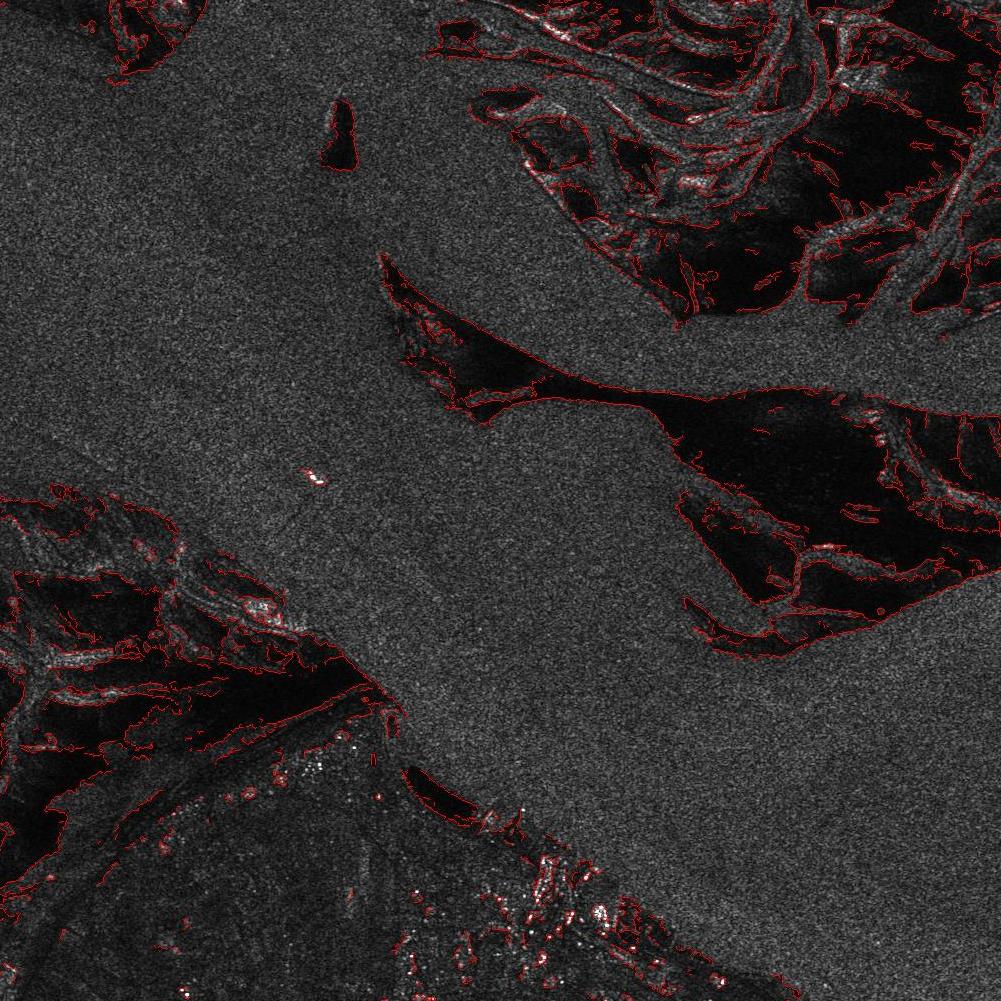 The Waterline Method: In the first step waterlines are extracted from
several images acquired at different tidal levels. Because of
the speckle-noise in the SAR-images advanced image processing techniques are
required for an acurate detection of the waterlines. The right image shows the
results of the edge detection process using a wavelet based algorithm. After
geocoding the SAR images, each point of the extracted waterlines is assigned
to a water level provided by a water level model to represent the height of
the sea bottom. The operational model of the German Maritime and Hydrographic
Agency (BSH) calculates currents and water levels based on forecasts of wind
and air pressure above the North Sea. The heights of the points along each
waterline form a random grid of topographic points with a wide spacing when
the gradient of the sea bottom is flat and with a narrow spacing when the gradient
is steep. A digital elevation model can be derived from this irregular grid by
triangulation and interpolation.
The Waterline Method: In the first step waterlines are extracted from
several images acquired at different tidal levels. Because of
the speckle-noise in the SAR-images advanced image processing techniques are
required for an acurate detection of the waterlines. The right image shows the
results of the edge detection process using a wavelet based algorithm. After
geocoding the SAR images, each point of the extracted waterlines is assigned
to a water level provided by a water level model to represent the height of
the sea bottom. The operational model of the German Maritime and Hydrographic
Agency (BSH) calculates currents and water levels based on forecasts of wind
and air pressure above the North Sea. The heights of the points along each
waterline form a random grid of topographic points with a wide spacing when
the gradient of the sea bottom is flat and with a narrow spacing when the gradient
is steep. A digital elevation model can be derived from this irregular grid by
triangulation and interpolation.
This procedure will be used to evaluate a total of 76 ERS-SAR-Images taken between 1995 and 1999. The maps are derived for each year and are used to observe the sediment transport in the recent years.
Cooperations
Related Links
Conferences
- Klocke, B., Schmidt, R., Heygster, G.: Topographische Karte des Wattenmeeres aus ERS SAR-Daten. Jahrestagung 2000 des Arbeitskreises "Geographie der Meere und Küsten" (AMK), Vechta 31. Mai-3.Juni 2000.
- Klocke, B., Dannenberg, J., Schmidt, R., Müller-Navarra, S., Heygster, G.: Topographic mapping of the german tidal flat areas using ERS-SAR images, ERS-ENVISAT Symposium, Göteborg 16.-20. Oktober 2000.
Publication
- Dannenberg, J., Klocke, B.: Erstellung topographischer Karten des Wattenmeeres, Vechtaer Studien zur Angewandten Geographie und Regionalwissenschaft, Band22, pp.44-51
Inhalt: