| Instrument |
General features
The ASUR (Airborne SUbmillimeter Radiometer
[von König et al., 2000, Küllmann et al., 1999]) is an airborne radiometer
measuring the thermal emission of trace gases in the stratosphere (in an altitude range
between 15 and 50 km). The instrument detects the radiation in a frequency range between 604.3 and 662.3 GHz.
This corresponds to wavelengths of about 0.45-0.5 mm. In this frequency range a major part of the radiation
is absorbed by atmospheric water vapor. As most of the water vapor is found in the troposphere
(in the Arctic up to 8 km, in the tropics up to 16 km altitude) the instrument is operated on board
of an aircraft flying at an altitude of 10-12 km, such that a major part of the water vapor absorption
is avoided.
The ASUR instrument in its current configuration can measure emission lines of the trace gases
HCl, ozone, ClO, N2O, HNO3, CH3Cl, H2O, BrO,
HO2, HCN, and NO. The horizontal resolution of the measurements ranges between 12 and 50 km
and depends on signal intensity and aircraft speed. The maximum time of continuous operation is 10-11 hours
and is determined by the storage volume of liquid cryogen (see section Setup).
The hardware of the ASUR instrument [Whyborn et al., 1996, Mees et al., 1995]
has been developed and built in a collaboration between
SRON
(Space Research Organisation of the Netherlands), Groningen and the
Institute of Environmental Physics
of the University of Bremen. The spectrometers AOS (Acousto-Optical Spectrometer) and CTS
(Chirp-Transform Spectrometer) were developed , in the framework of an ESA/ESTEC project
by the Observatoire de Meudon, Paris, and the Deutsche Aerospace (now: ASTRIUM), respectively.
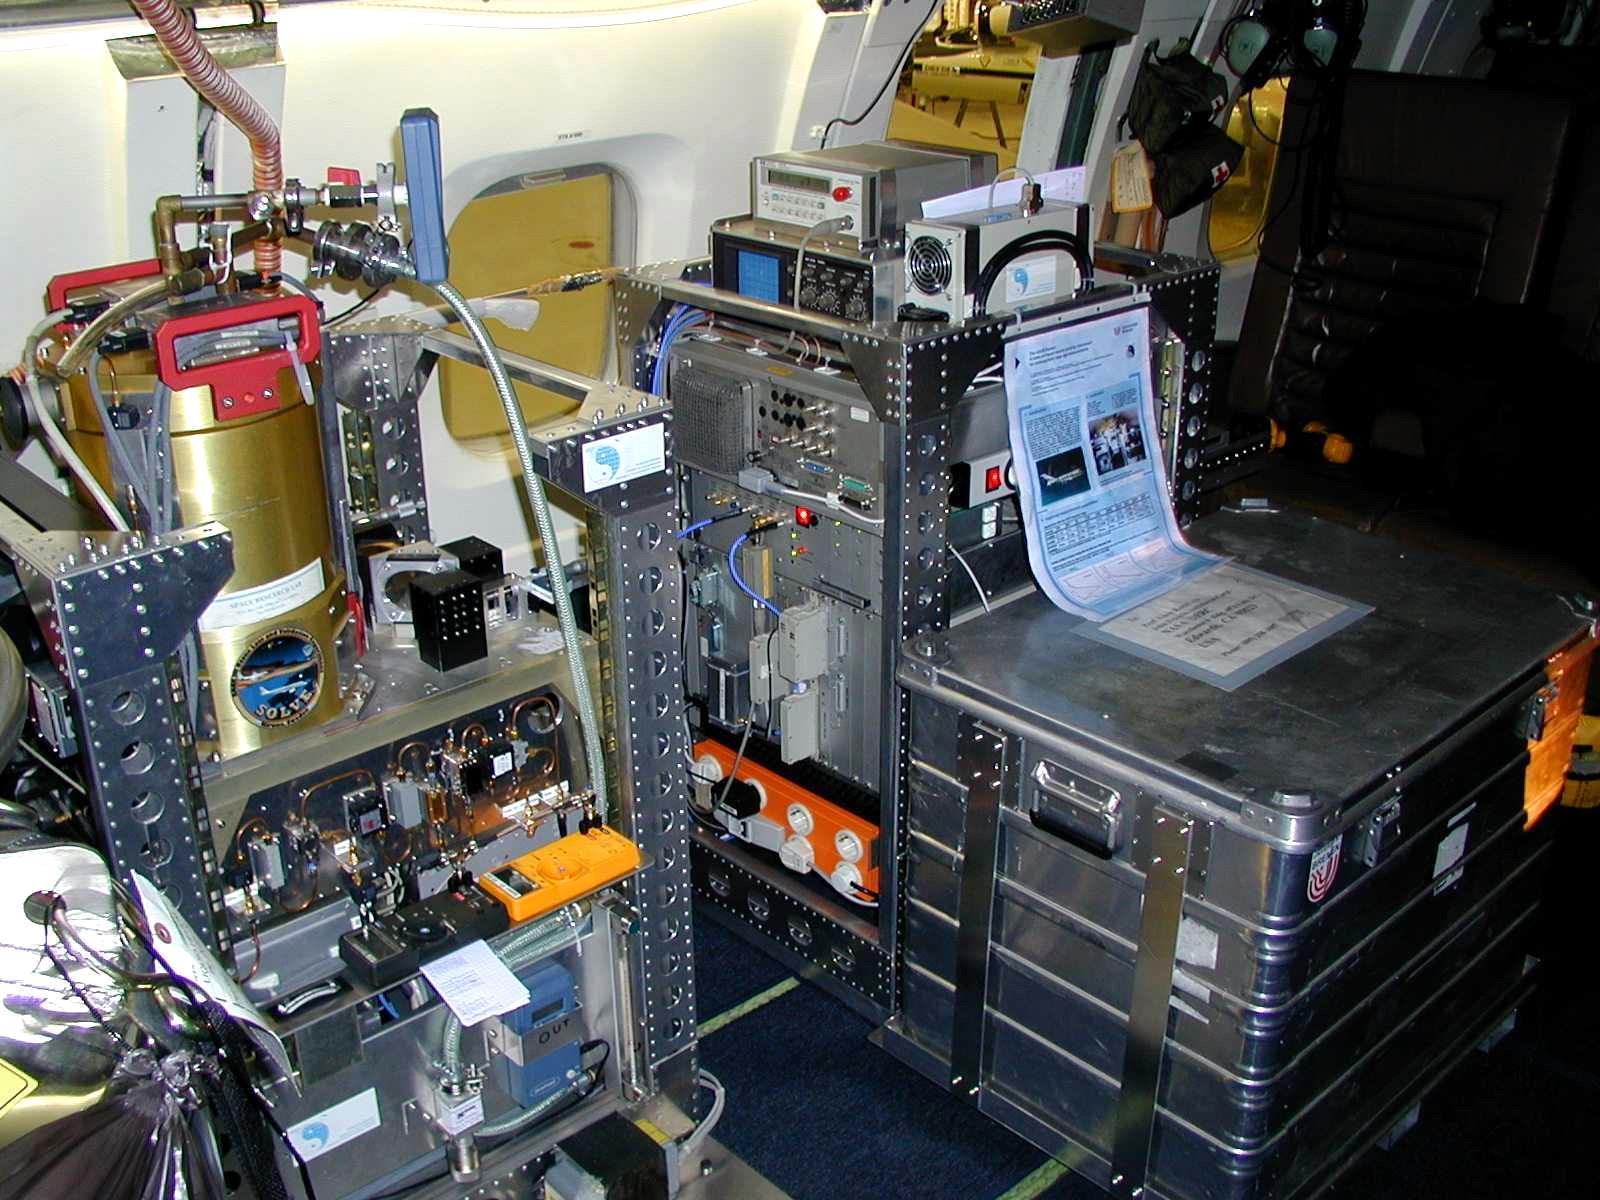
Setup
The setup of the ASUR instrument is schematically drawn in the following block diagram.
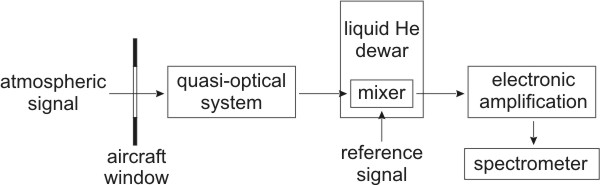
The atmospheric signals reach the interior of the aircraft and ASUR's rotatable mirror
through a special window (made of polyethylene). The rotatable mirror reflects the atmospheric signals and also
two calibration signals into the ASUR instrument. In the normal measurement mode the mirror switches
continuously between the atmospheric signals and the calibration signals. Further the mirror control enables
to adjust the mirror to correct for the rolling of the aircraft (turning around the longitudinal axis),
such that all atmospheric measurements are taken with the same elevation angle.
Behind the mirror the signals reach a quasi-optical setup. Here unwanted frequencys and standing waves
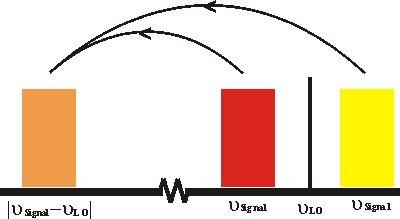
are filtered out or suppressed. Further an additional signal (local oscillator signal or LO-signal) with
a defined frequency is heterodyned with the original signal. At the output of the quasi-optical setup the signal
is received by a detector. In this detector a differential signal of the original signal and the LO-signal
is generated (see following sketch). This process is termed as mixing and results in a transformation
of the original signal to a lower frequency without losing the spectral information.
The detector is a superconducting diode that is located in a dewar filled with liquid helium and
liquid nitrogen. The liquid helium has a temperature of about 4 K (about -269° C), only at these
temperatures the superconduction is possible. The liquid nitrogen (about 77 Kelvin, -196° C)
is needed as a heat buffer between the liquid helium temperature and the ambient temperature.
For this reason there are also evacuated volumes between the different tanks in the dewar.
The superconducting diode enables the detection of very weak signals as well as a reduction
in acquisition time for strong signal, which in turn
leads to higher temporal resolution of the measurements.
At the output of the diode, that is after the first mixing process, the signals have a frequency of
11,4 GHz (+/-2,25 GHz). In two following mixing steps they are transformed to the input frequencies of the
two spectrometers: AOS at 2,3 GHz (+/-0,75 GHz) and CTS at 1,35 GHz (+/-0,09 GHz). On their way from the
turning mirror to the the signals have experienced an amplification of about 80 dB
(a factor of 108 = 100.000.000).
Inside the spectrometers the signals are analyzed and digitized, such that the spectral information
can be read out by a computer.
Thus the measurements yield spectra of the different trace gases. Their further analysis
is described in the section retrieval method.
References:
Author: 15/08/2002
Holger Bremer
Designer: 08/04/2002
Tianxun Ba
Last update