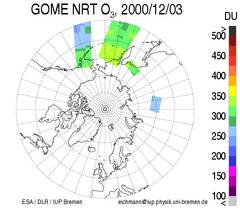
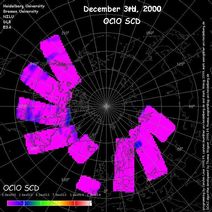
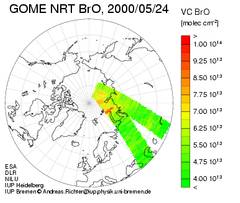
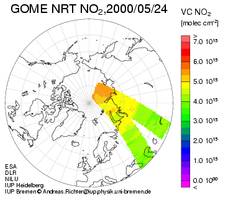
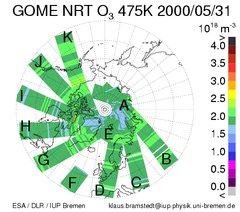
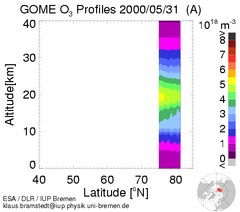
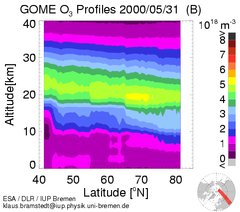
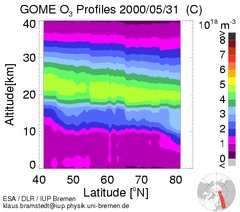
The Newest Maps
| Each of the images are
updated several times per day. Thus the images provided on this page
are the most recent ones available. Archives on older data are found
in the subsection of each tracegas listed to the right.
ATTENTION: In February regular maintainance operations to
extend the lifetime of the ERS-2 satellite are planned. Data gaps in
GOME coverage are therefore to be expected for the periods 7-10
February and 16-17 February 2000. Cooler switching of the GOME
detectors and/or slight mispositioning may be responsible for
temporary degradation of spectral data and derived NRT trace gas
product quality until ERS2 and the GOME spectrometer are stabilized
after nominal operation resumed.
The results on this page
are preliminary!
Responsible: Kai-Uwe Eichmann / Klaus Bramstedt / Andreas Richter / Thomas Wagner, IUP Heidelberg / Bill Arlander, NILU / Last Change. |
