GOME NRT OClO
Please note that these maps are small versions and that each map is
clickable. A new window will appear with the normalsized jpg-version
of the map. You should use a browser with activated
JavaScript. Otherwise go to the Archive section down below, where a data
page for each day is available. A brief introduction can also be found further
down below.
The results on this page
are preliminary!
Archive
|
|
|
| May |
|---|
|
01 |
08 |
15 |
22 |
29 |
|
02 |
09 |
16 |
23 |
30 |
|
03 |
10 |
17 |
24 |
|
|
04 |
11 |
18 |
25 |
|
|
05 |
12 |
19 |
26 |
|
|
06 |
13 |
20 |
27 |
|
|
07 |
14 |
21 |
28 |
|
|
Introduction
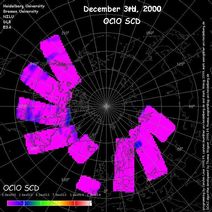
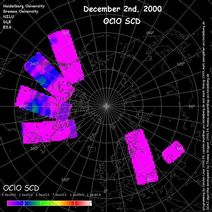
One specific aim of the GODIVA project is to support THESEO-2000 by
producing daily maps of the atmospheric OClO column densities from near
real time GOME data. Since OClO is produced by the reaction of BrO and
ClO it can be used as an indicator for chlorine activation of the
stratosphere. Thus daily OClO maps of the polar region could provide
unique information about the status of the stratospheric chemistry. In
particular they might be used for the planning of stratospheric balloon
launches within THESEO-2000. The University of Heidelberg (in
co-operation with the University of Bremen,) has developed and validated
an algorithm for the detection of the atmospheric OClO absorption from
GOME. The level 1 GOME data is transferred to the NADIR data base at
NILU (Norwegian Institute for Air Research) where the daily spectral
analysis of the OClO is carried out. These maps contain up to 10 of the
14 daily orbits. The produced GOME OClO maps show the so-called slant
column density (SCD) of OClO for each single GOME measurement. The SCD
is the integrated atmospheric OClO concentration along the light path of
a GOME observation. Thus it depends strongly on the length of the light
path through the atmosphere which is a function of the solar zenith
angle (SZA) at the observation site, which in turn largely depends on
the latitude. Enhanced OClO absorption is generally only detected when
the stratospheric temperatures inside within the polar vortex below ca.
200K. Occasionally, 'apparent' OClO absorption may appear outside of the
polar vortex on the maps. This should be regarded as an artifact in the
NRT analysis program. Please note: Since for GOME measurements the SZA
changes with latitude, different OClO SCDs for different latitudes do
not necessarily represent different degrees of chlorine activation. In
addition, OClO is rapidly photolysed at increasing SZA. Thus we
recommend using these maps for a qualitative indication of stratospheric
chlorine activation.
Responsible: Thomas Wagner,
IUP Heidelberg / Bill Arlander, NILU / Last Change.
|
|


|
)
)