GOME NRT Nitrogen Dioxide
|
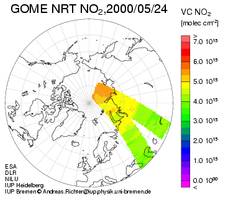
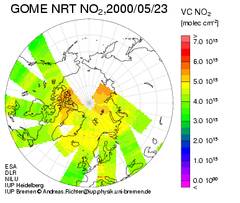
Please note that these maps are small versions and that each map is clickable. A new window will appear with the normalsized jpg-version of the map. You should use a browser with activated JavaScript. Otherwise go to the Archive section down below, where a data page for each day is available. A brief introduction can also be found further down below. The results on this page are preliminary!
Archive
IntroductionIn the DOAS retrieval, atmospheric absorbers are identified by their characteristic spectral absorption signature. In order to separate molecular absorptions from broad band scattering features, only the differential part of the absorption is used. In the case of NO2, the absorption bands in the 425 to 450 nm region are used for the detection. As GOME is essentially a nadir viewing instrument, the result of the DOAS analysis is the absorber column integrated along the line of sight. To convert this into a vertical column, the light path through the atmosphere is modelled using radiative transfer calculations, and a correction factor (airmass factor or AMF) is applied to the measurements. This airmass factor depends on the assumed vertical profile of the absorber, in particular in the UV. All NO2 plots on this page are derived using a standard airmass factor derived using the profiles from the US standard atmosphere. This implies, that tropospheric NO2 pollution over industrialised regions are underestimated, in particular during winter. The NO2 columns in these regions are therefore to be interpreted in a qualitative way only. More detailed information on the GOME NO2 analysis at the University of Bremen and the validation of GOME measurements can be found in the following publication:
More on NO2 from GOME can be found in the following publication:
Responsible: Andreas Richter / Last Change. | ||||||||||||||||||||||||||||||||||||||||||||||||||||||||||||||||||||||||||||||||||||||||||||||||||||||||||||||||||||||||||||||||||||||||||||||||||||||||||||||||||||||||||||||||||||||||||||||||||||||||||||||||||||||||||||||||||||||||||||||||||||||||||||||||||

