
![]()
![]()
![]()
![]()
![]()
![]()
![]()
![]()
![]()
![]()
![]()
Research
![]()
![]()
![]()
![]()
![]()
![]()
Navigate
![]()
![]()
![]()
![]()
![]()
![]()
![]()
![]()
![]()
![]()
![]()
![]()
![]()
![]()
![]()
Stratospheric NO2 data from GOME-2B
Introduction Station Data Disclaimer Contact Links
Introduction:
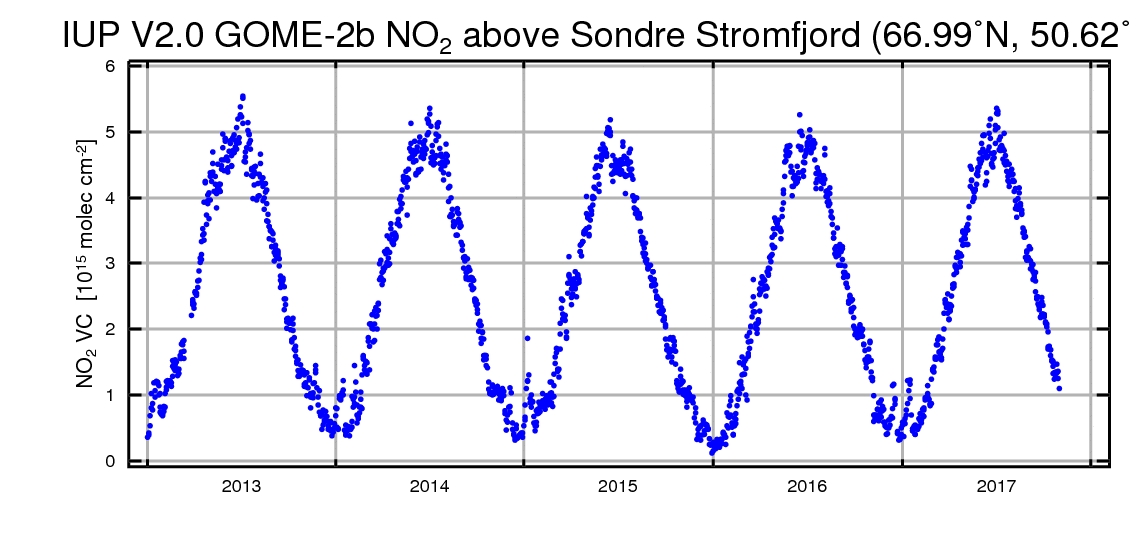
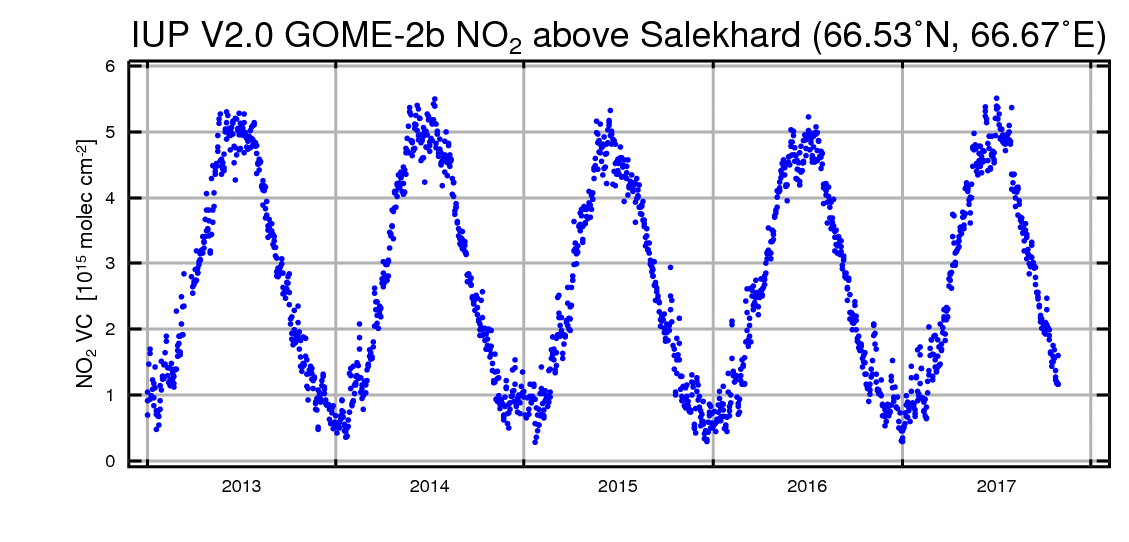
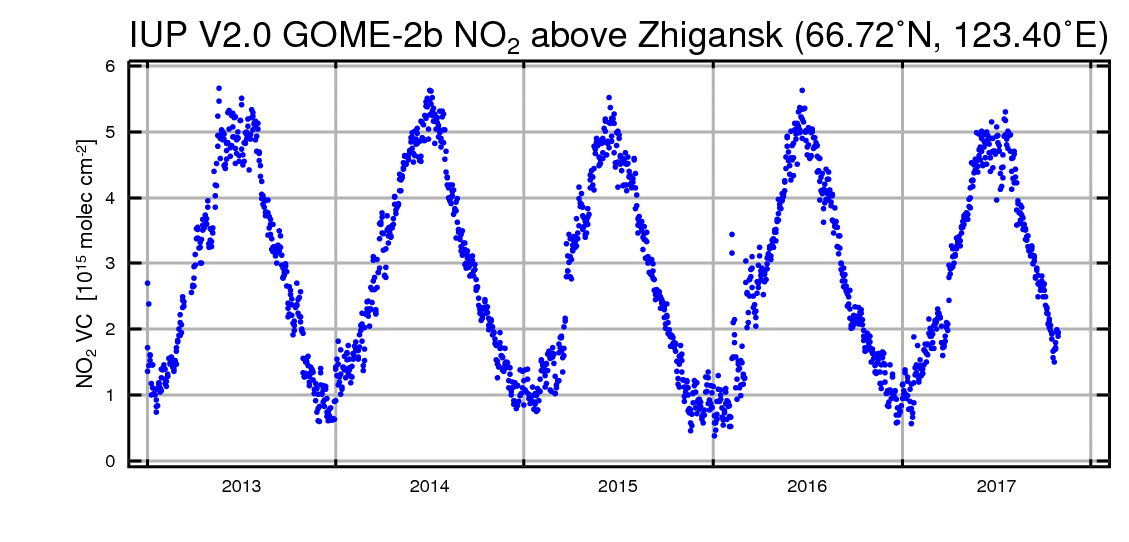
For validation purposes, a time series of daily GOME-2B NO2 columns (January 2013 - October 2017) within a 200 km radius has been created which can be downloaded in ASCII format for a number of validation stations.

For data before GOME-2B operations, please have a look at our GOME-2A stratospheric NO2 page or the SCIAMACHY stratospheric NO2 page or the GOME stratospheric NO2 data page.
 GOME-2B
stratospheric NO2 columns over stations Version 2.0:
GOME-2B
stratospheric NO2 columns over stations Version 2.0:
This GOME-2B NO2 product produced at the University of Bremen is a simple total column data set assuming a purely stratospheric NO2 without tropospheric contribution. The retrieval settings are similar to those described in
- Richter, A., Begoin, M., Hilboll, A., and Burrows, J. P.: An improved NO2 retrieval for the GOME-2 satellite instrument, Atmos. Meas. Tech. , 4, 1147-1159, doi:10.5194/amt-4-1147-2011, 2011
with the exception of not including the empirical sand signature and the correction for GOME-2B polarisation sensitivity. To compensate for this, a higher degree polynomial is used.
Please also read the disclaimer.
Data Format
The data format is plain ASCII with 29 header lines starting with a '*' character followed by the lines with the data organized in 12 columns separated by blanks:
column 1: fractional day of year 1993 UT
column 2: fractional day of year UT
column 3: solar zenith angle [°]
column 4: daily average slant column of NO2 [molec cm-2] in 200 km radius
column 5: daily average vertical column of NO2 [molec cm-2] in 200 km radius
column 6: daily minimum slant column of NO2 [molec cm-2] in 200 km radius
column 7: daily minimum vertical column of NO2 [molec cm-2] in 200 km radius
column 8: daily maximum slant column of NO2 [molec cm-2] in 200 km radius
column 9: daily maximum vertical column of NO2 [molec cm-2] in 200 km radius
column 10: rms of NO2 slant columns
column 11: rms of NO2 vertical columns
column 12: average chisquare of retrieval
| Station data | Plot | Lat. | Long. |
| Eureka |
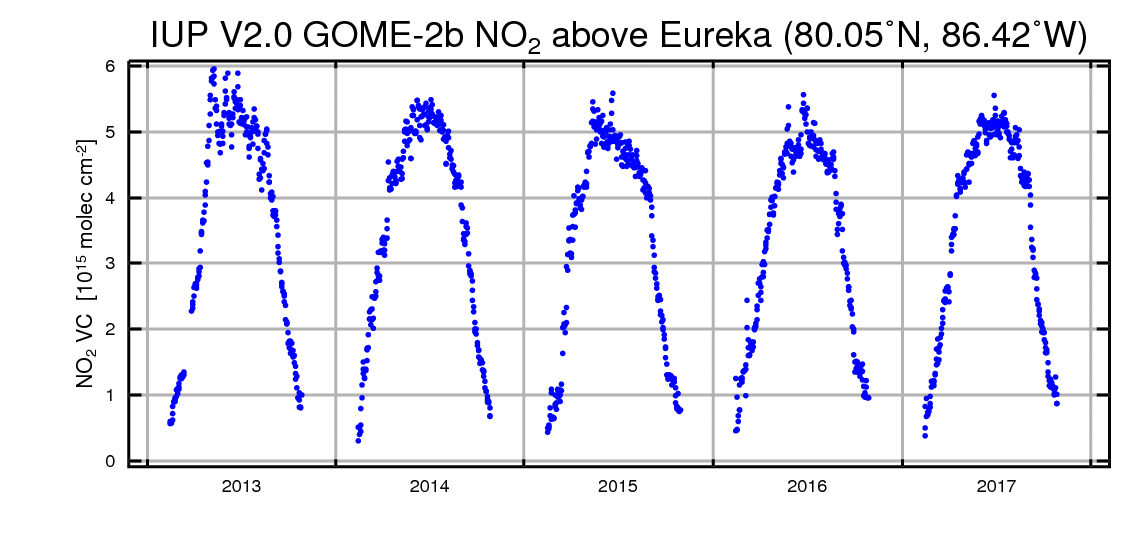
|
80.1°N | 86.4°W |
| Ny-Alesund, Spitzbergen |
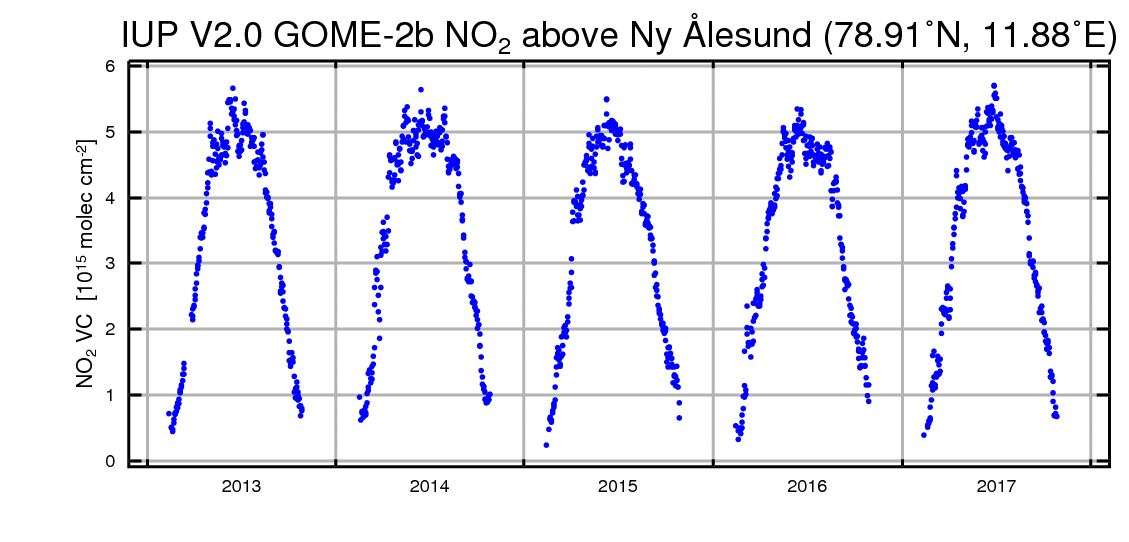
|
78.9°N | 11.9°E |
| Summit, Greenland |
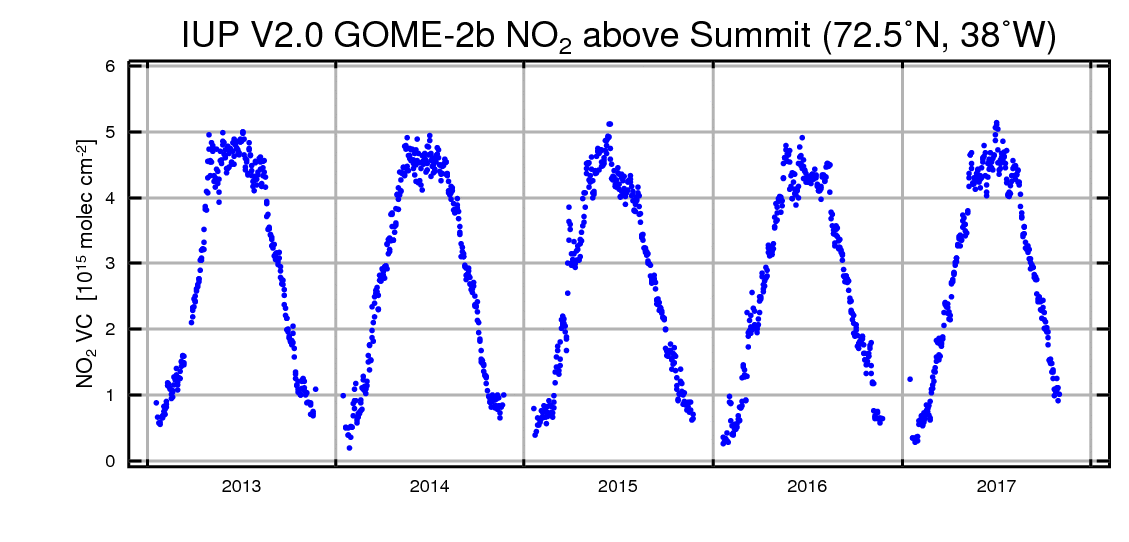
|
72.5°N | 38°W |
| Thule |
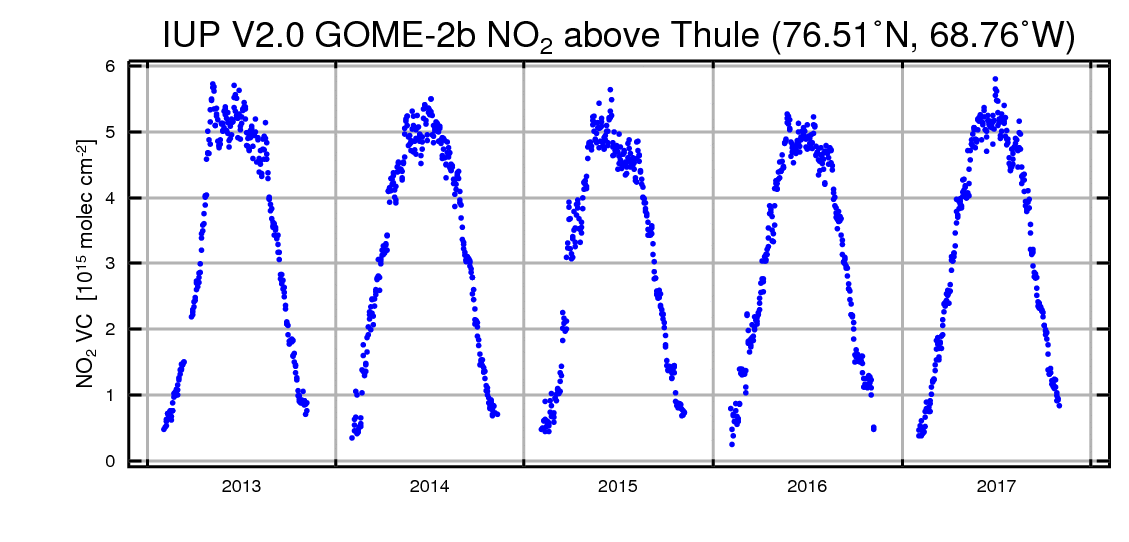
|
76.5°N | 68.8°W |
| Scoresbysund, Greenland |
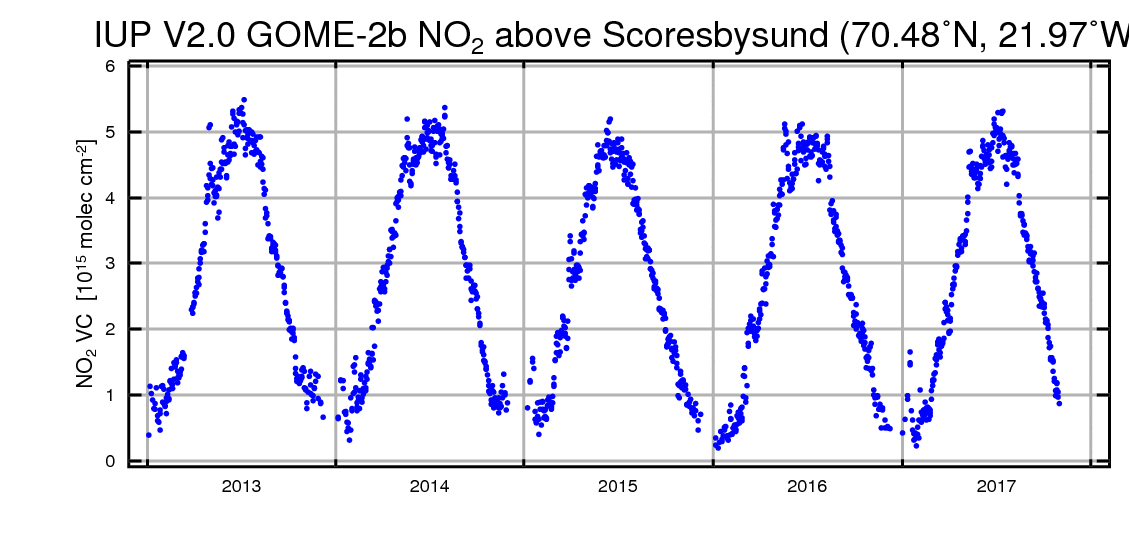
|
70.5°N | 22.0°W |
| Andoya, Norway |
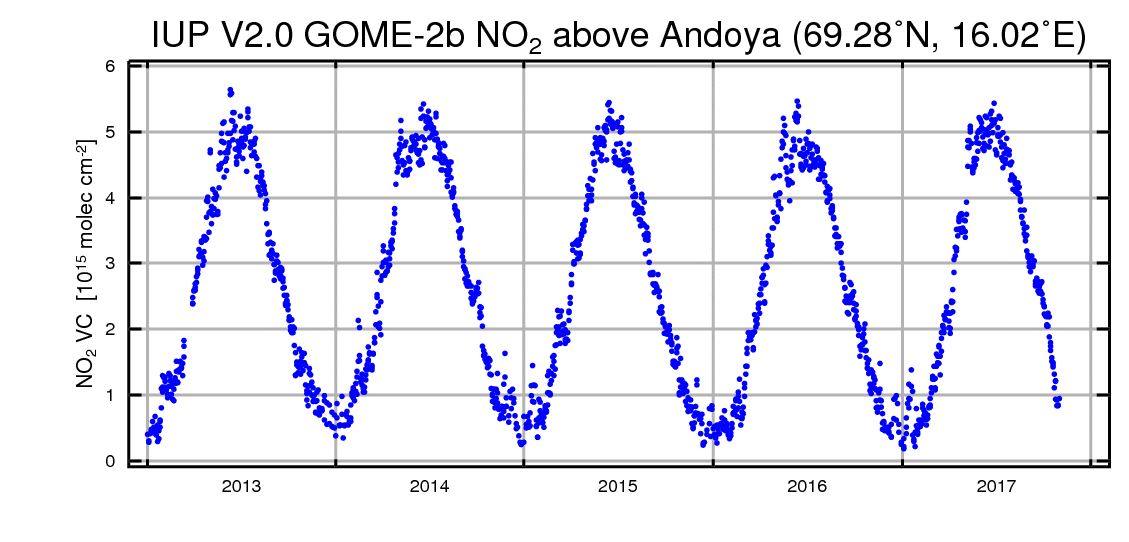
|
69.3°N | 16.0°E |
| Kiruna, Sweden |
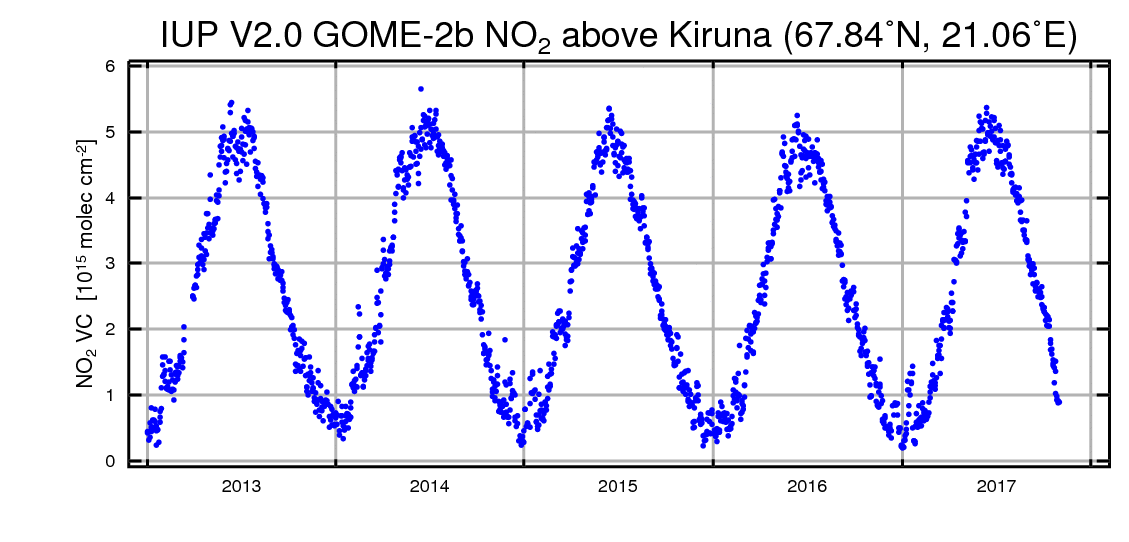
|
67.8°N | 21.1°E |
| Sodankyla, Finland |
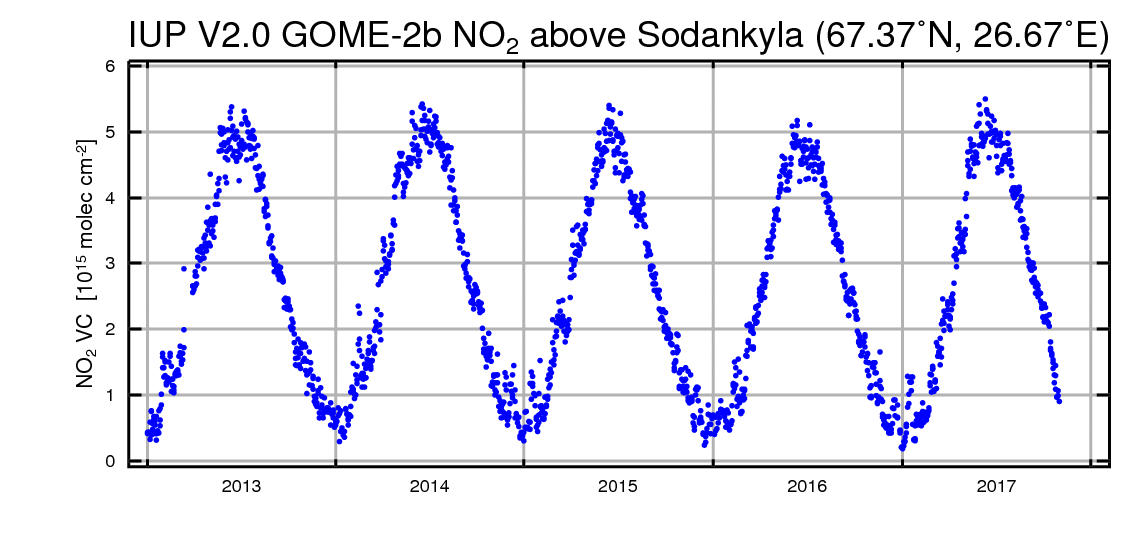
|
67.4°N | 26.7°E |
| Sondre Stromfjord, Greenland |
|
67.0°N | 60.6°W |
| Salekhard, Siberia |
|
66.7°N | 66.7°E |
| Zhigansk, Russia |
|
66.7°N | 123.4°E |
| Trondheim, Norway |
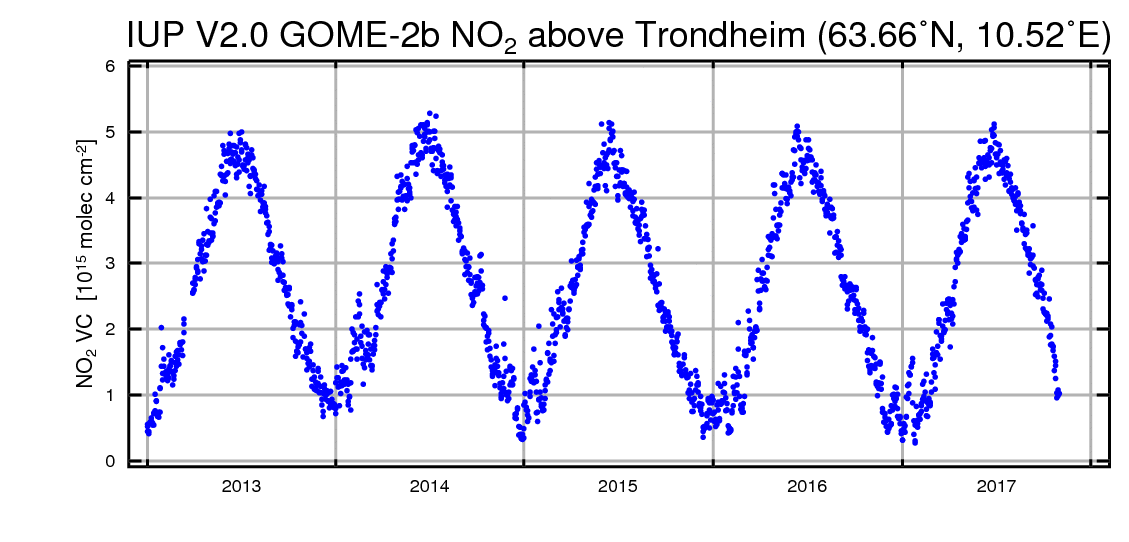
|
63.7°N | 10.5°E |
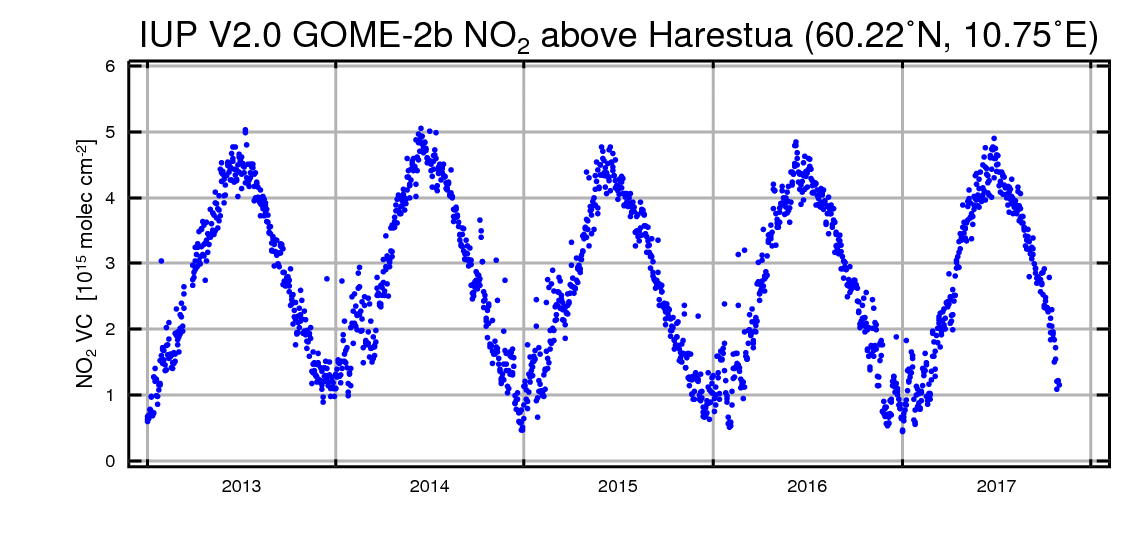
| Harestua, Norway |
|
60.2°N | 10.8°E |
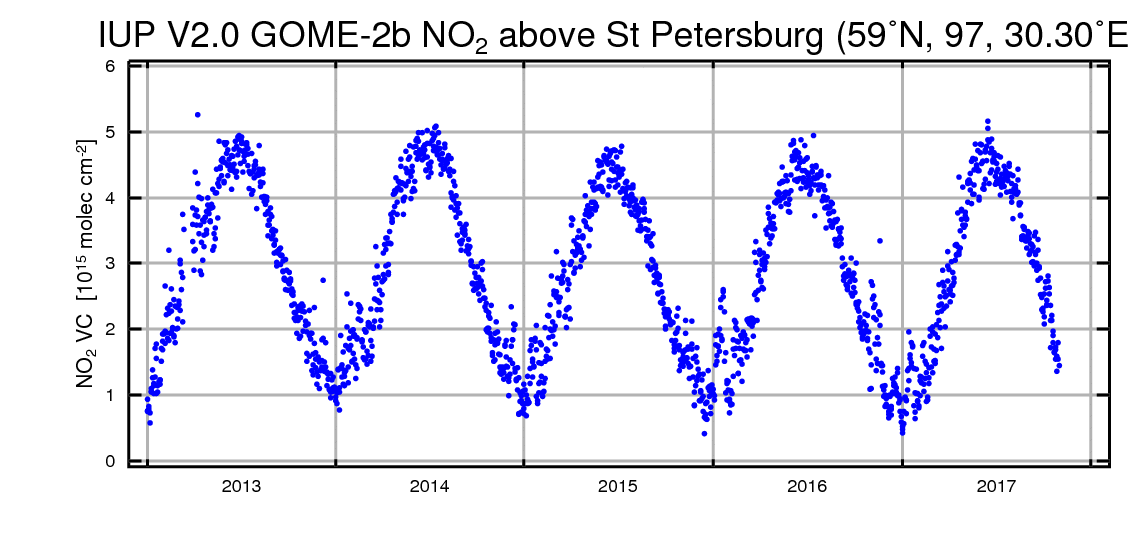
| St. Petersburg, Russia |
|
60.0°N | 30.3°E |
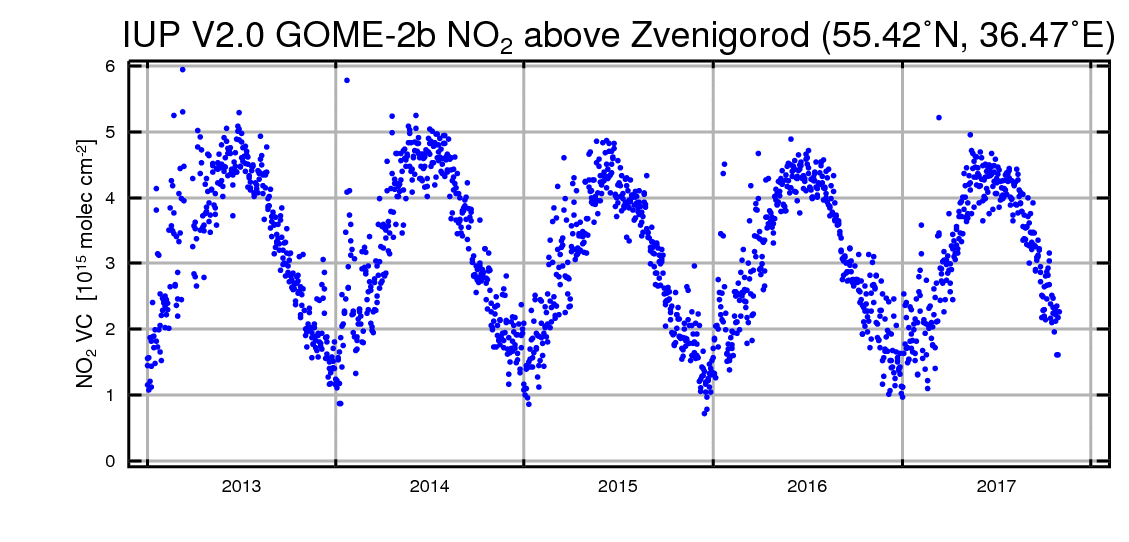
| Zvenigorod, Russia |
|
55.4°N | 36.5°E |
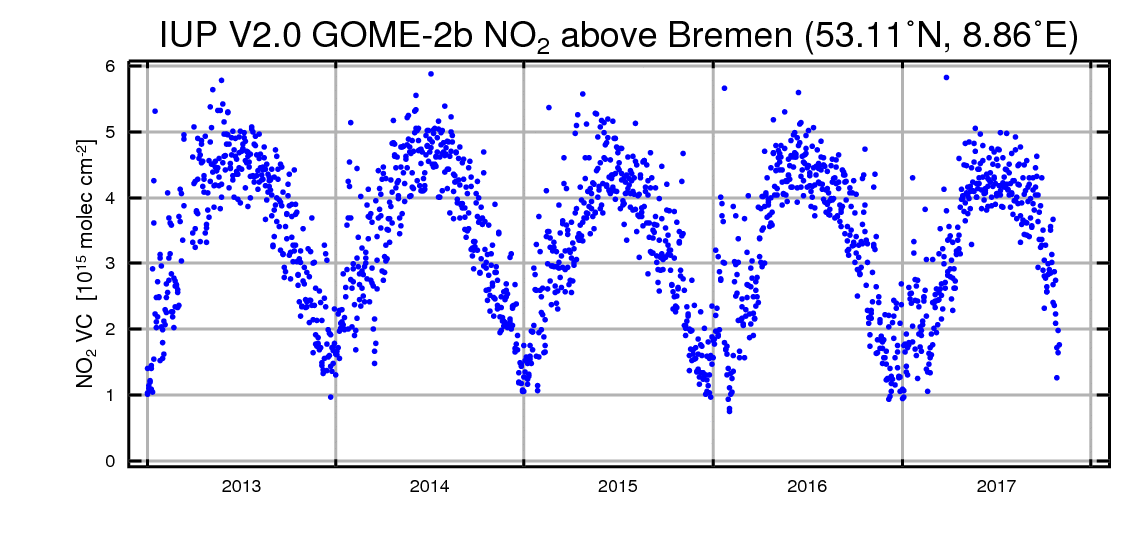
| Bremen, Germany |
|
53.1°N | 8.9°E |
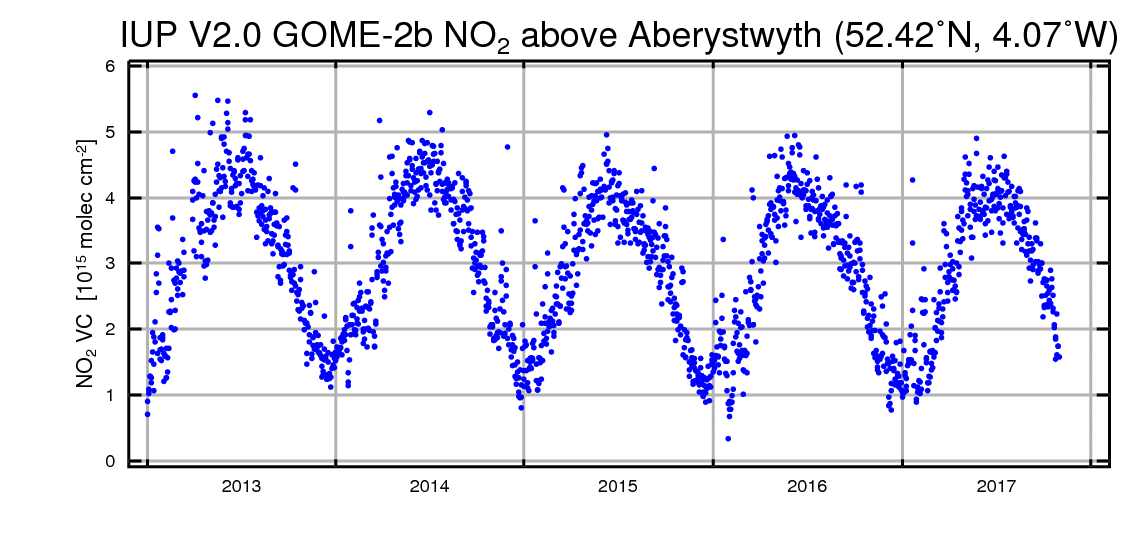
| Aberystwyth, UK |
|
52.0°N | 4.1°W |
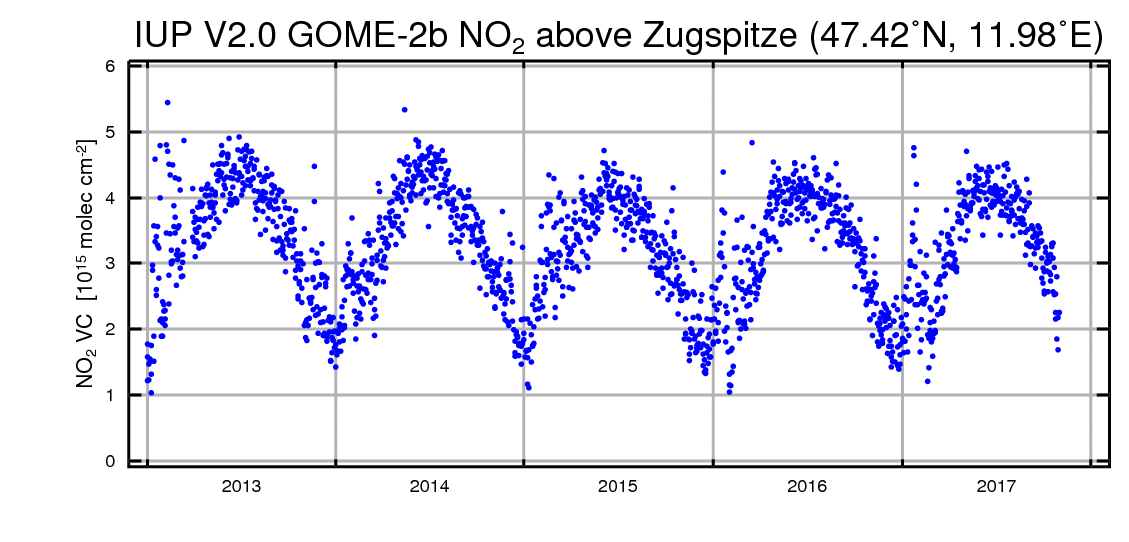
| Zugspitze, Germany |
|
47.4°N | 12.0°E |
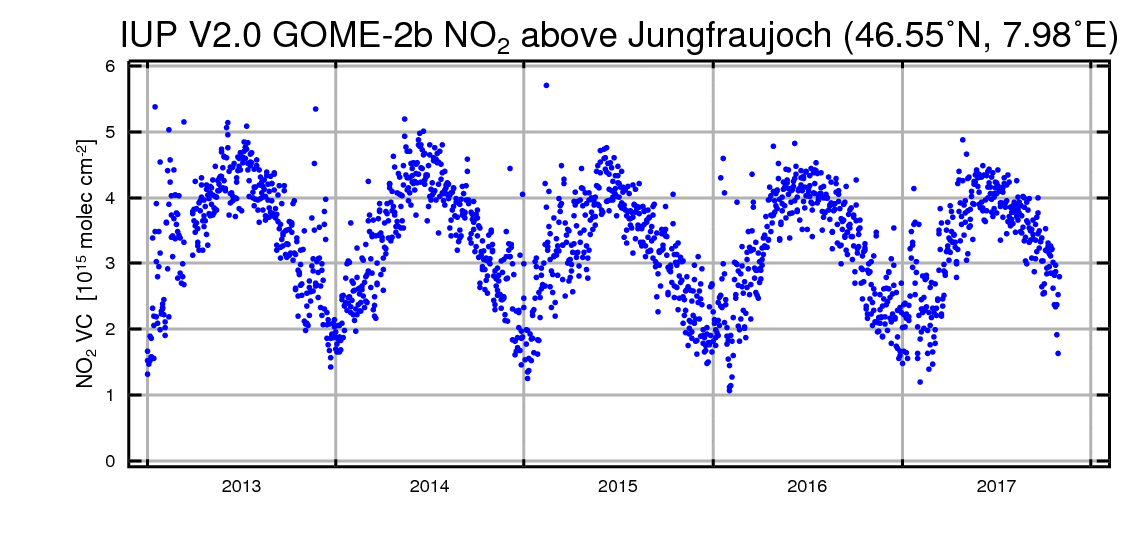
| Jungfraujoch, Switzerland |
|
46.6°N | 8.0°E |
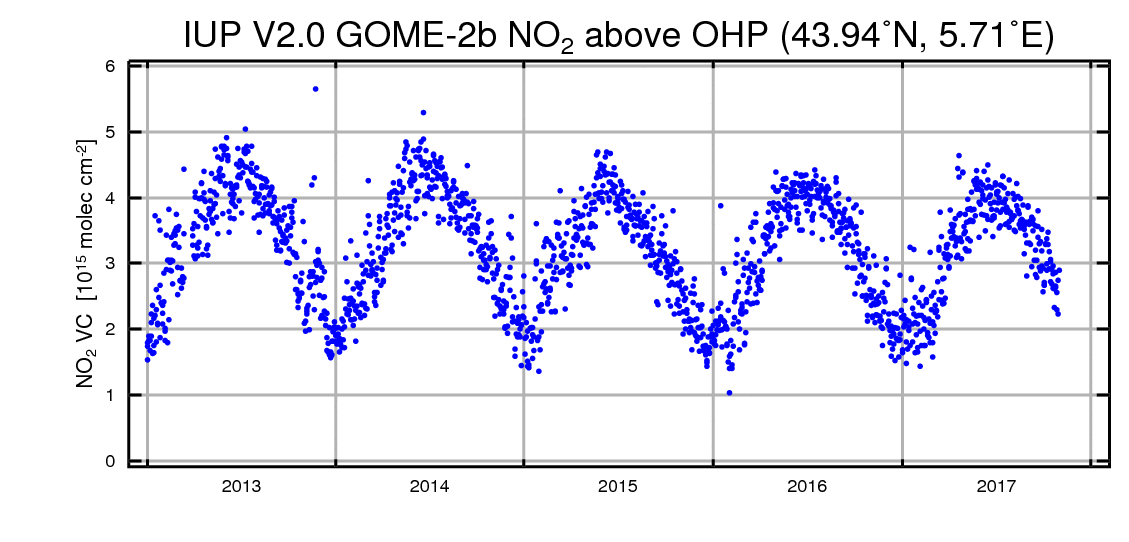
| OHP, France |
|
43.9°N | 5.7°E |
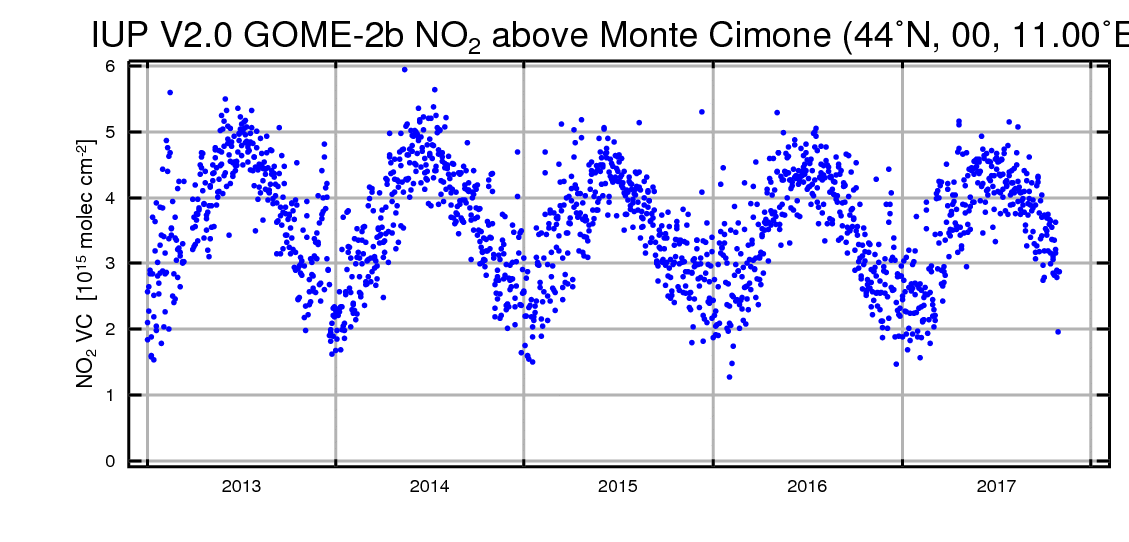
| Mt Cimone, Italy |
|
44.2°N | 10.7°E |
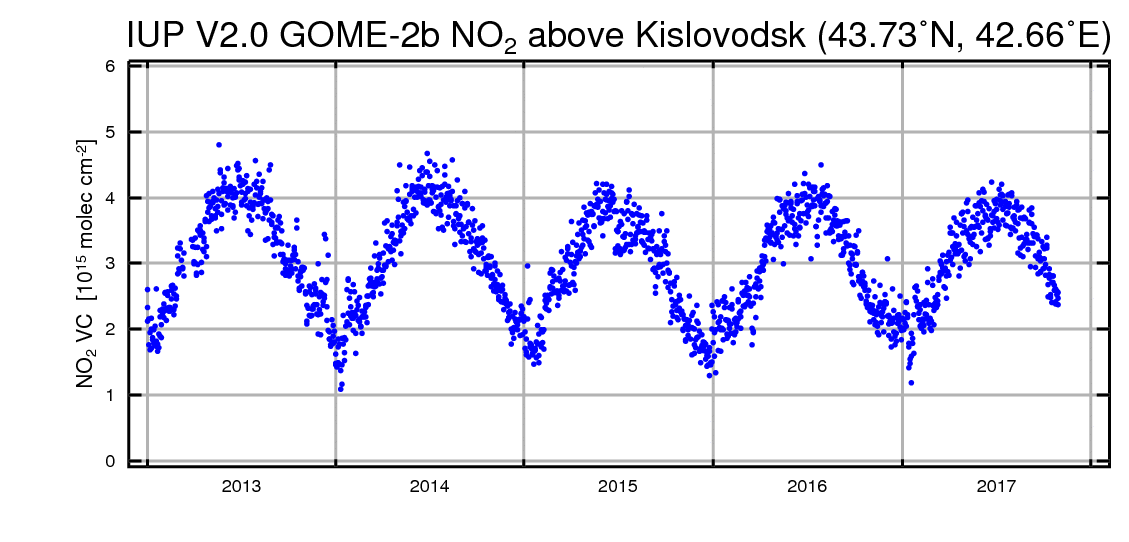
| Kislovodsk |
|
43.7°N | 42.7°E |
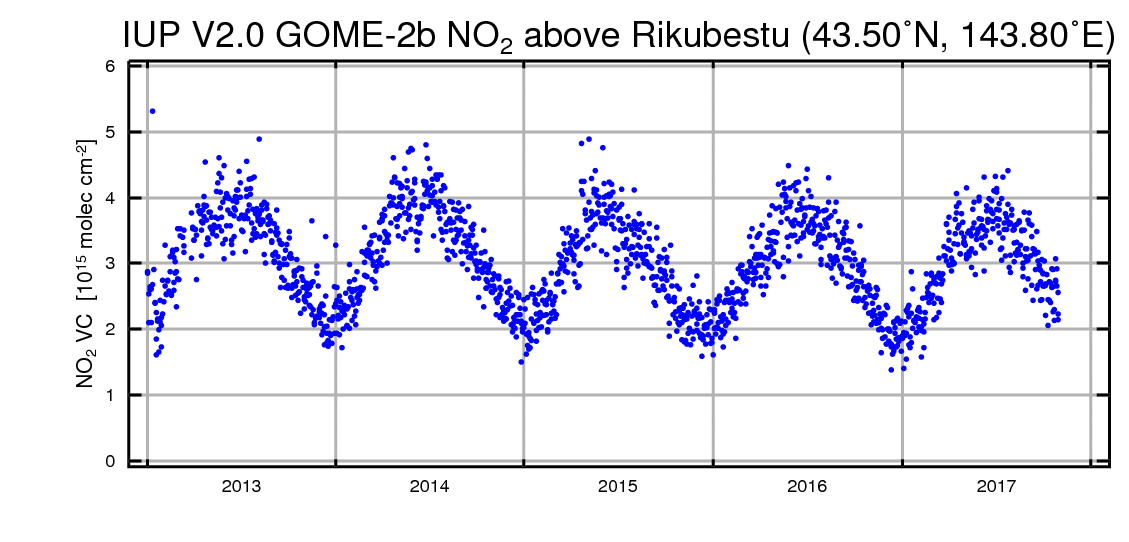
| Rikubestu |
|
43.5°N | 143.8°E |
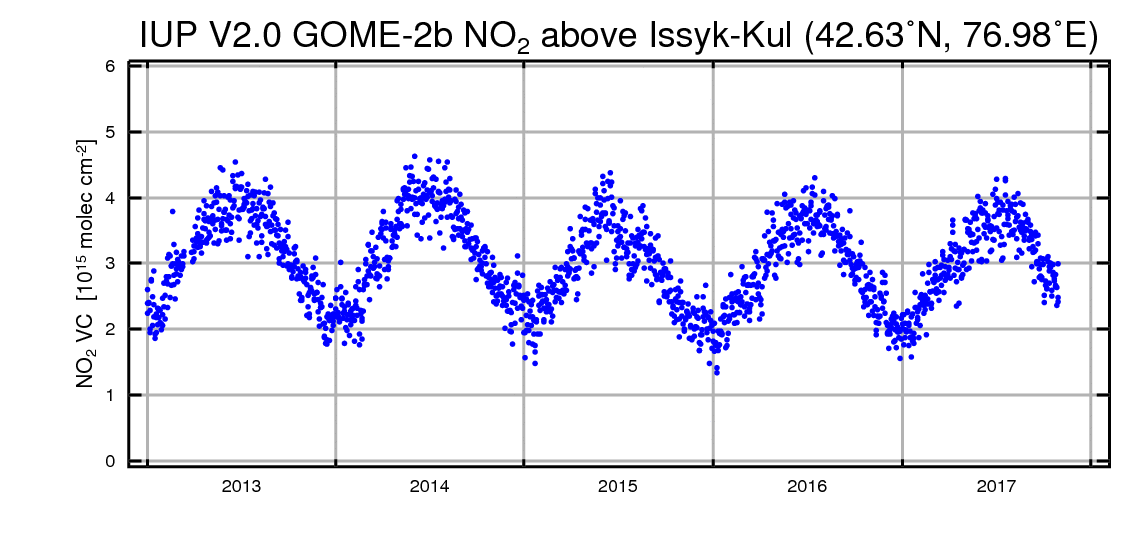
| Issyk-Kul |
|
42.6°N | 77.0°E |
| Stara Zagora, Bulgaria |
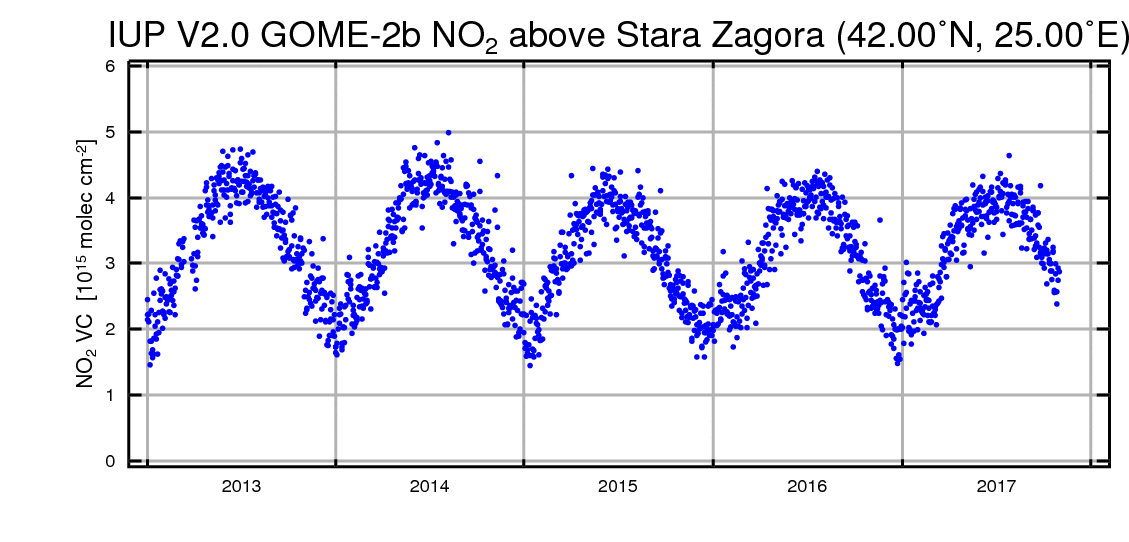
|
42.4°N | 25.0°E |
| Evora, Portugal |
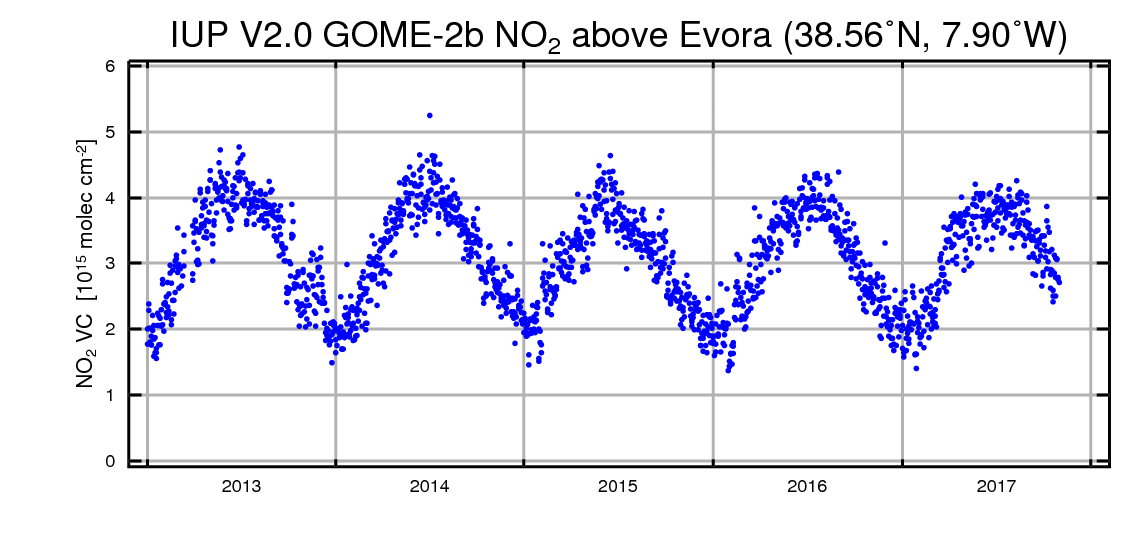
|
38.56°N | 7.90°W |
| Kiso |
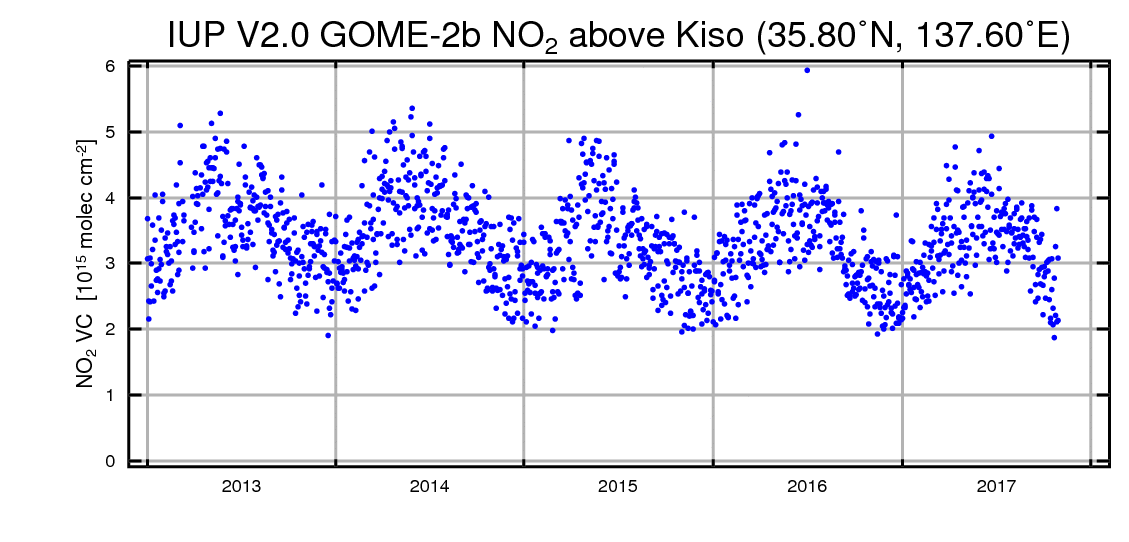
|
35.8°N | 137.6°E |
| Izana, Canaries |
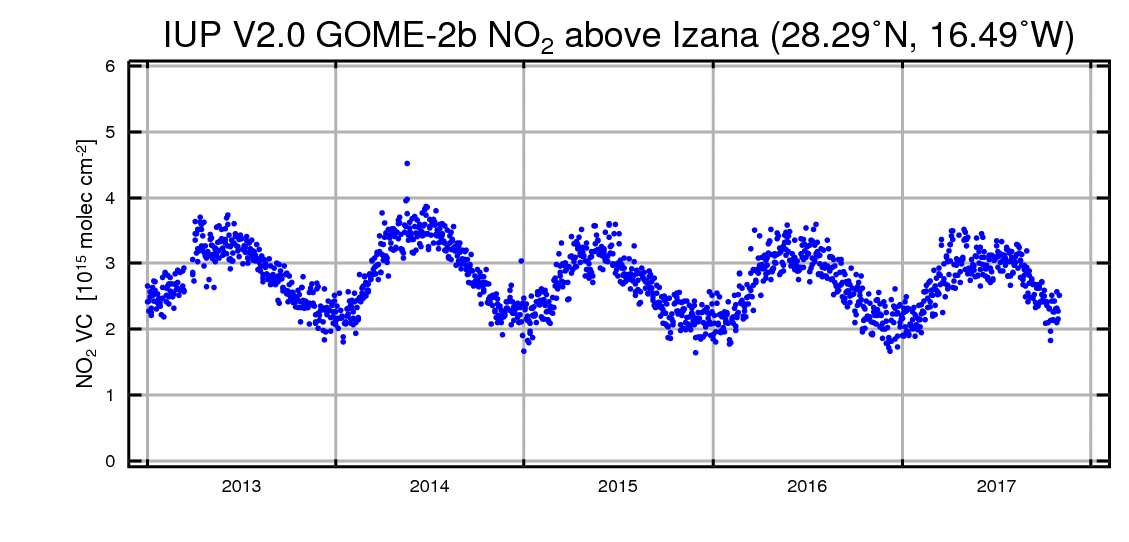
|
28.3°N | 16.5°W |
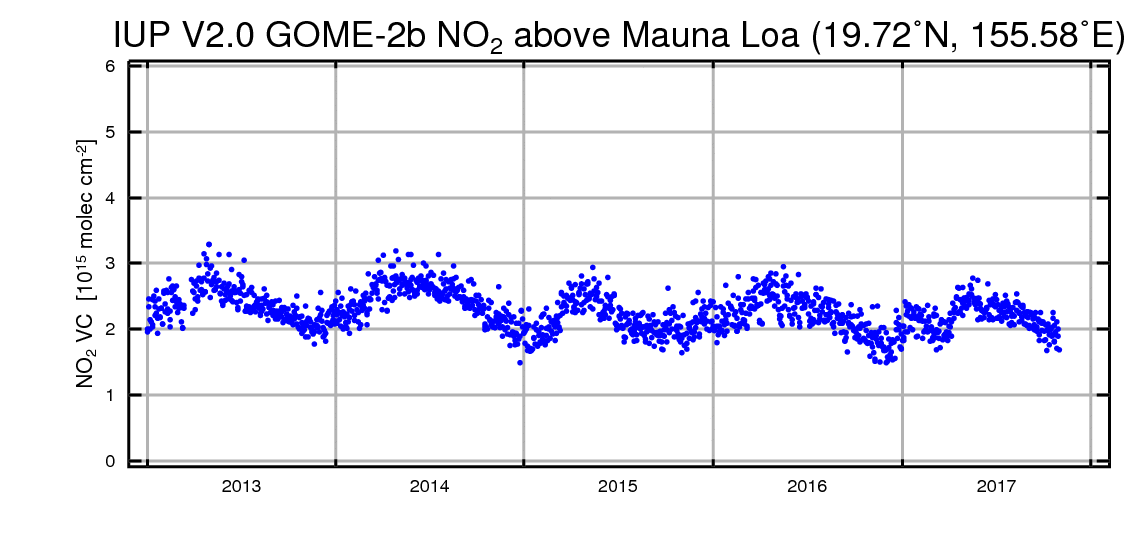
| Mauna Loa |
|
19.7°N | 155.6°E |
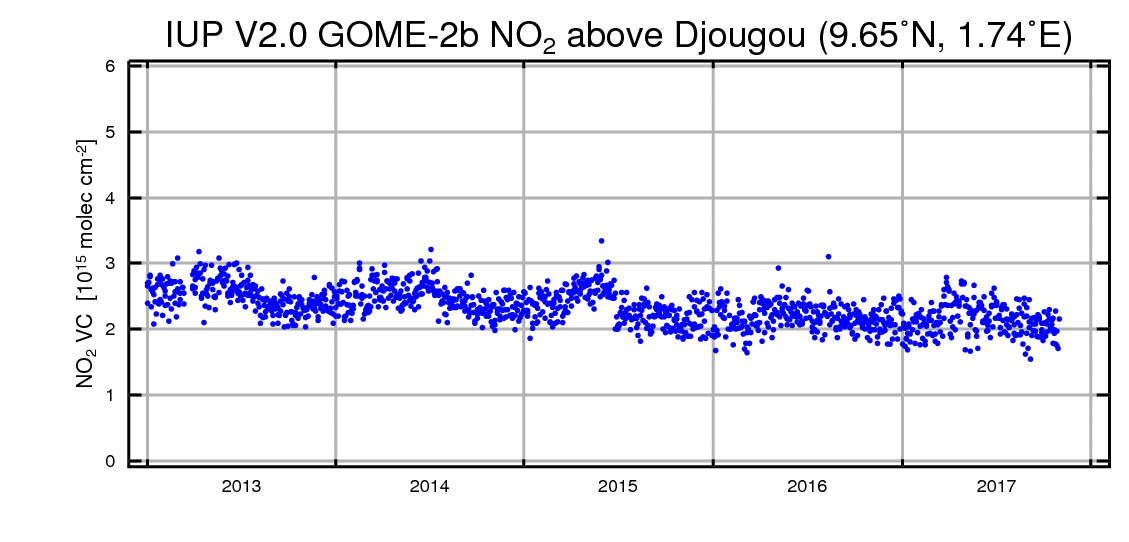
| Djougou |
|
9.7°N | 1.7°E |
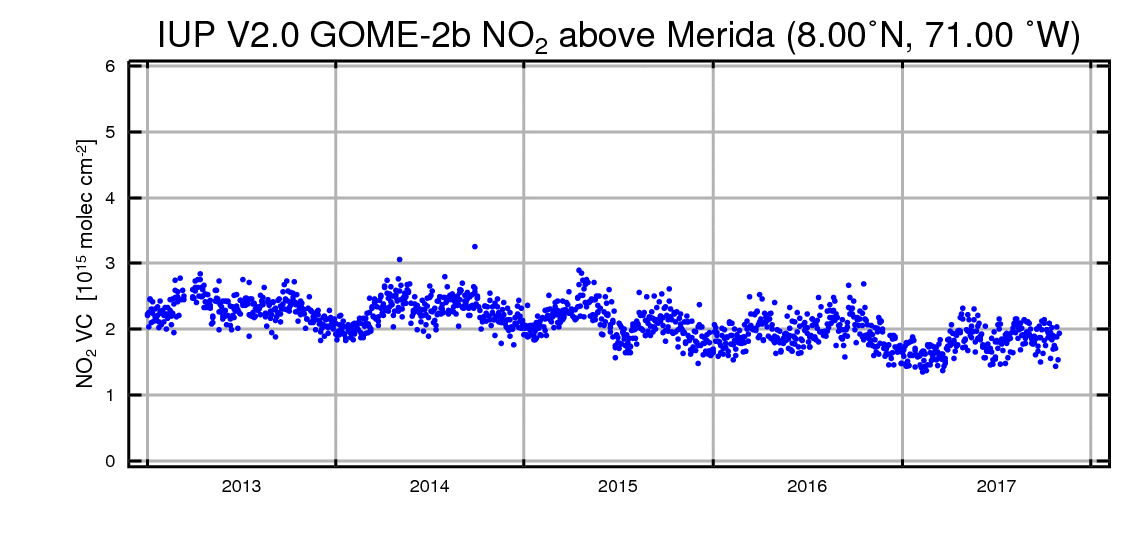
| Merida, Venezuela |
|
8.2°N | 71.1°W |
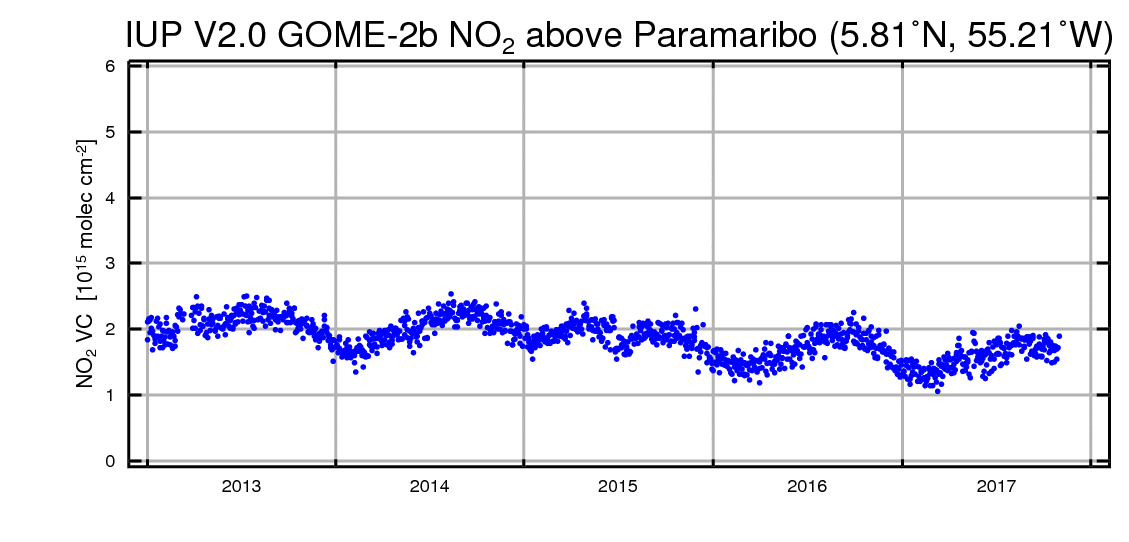
| Paramaribo, Suriname |
|
5.8°N | 55.2°W |
| Tarawa, Kiribati Republic |
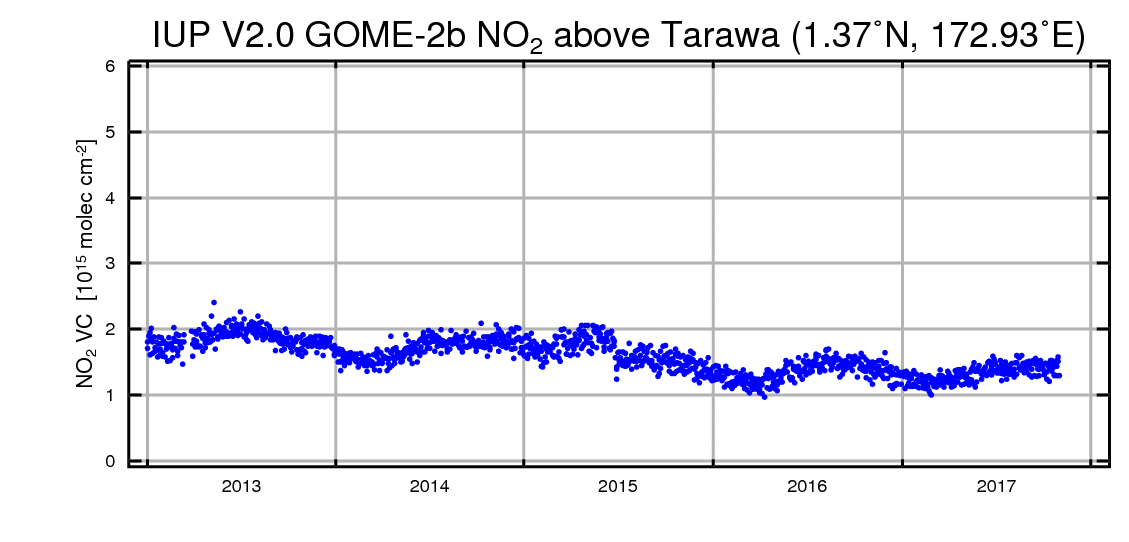
|
1.4°N | 172.9°E |
| Nairobi, Kenya |
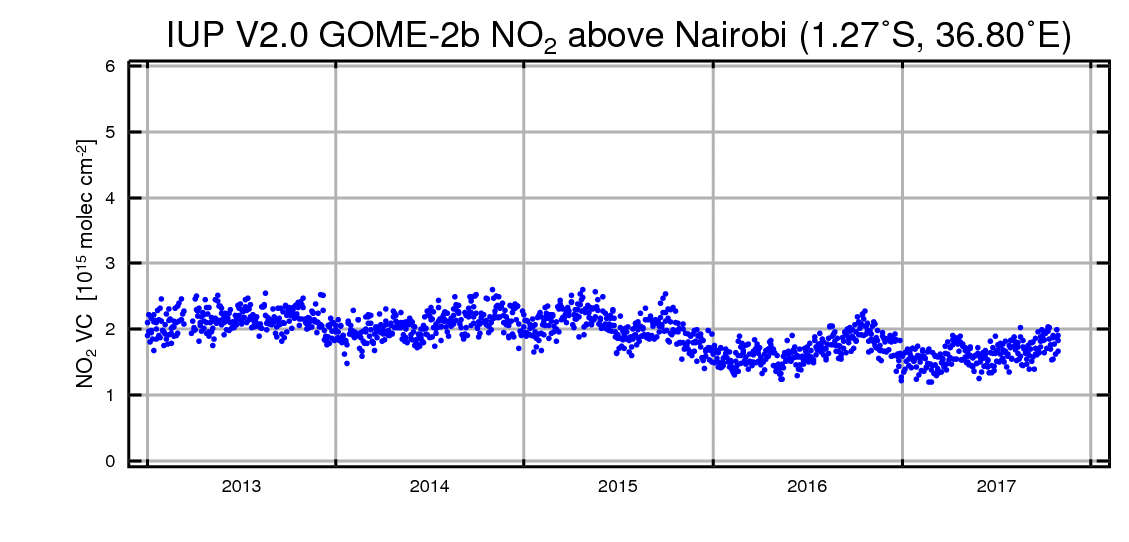
|
1.3°S | 36.8°E |
| Ciater Bandung |
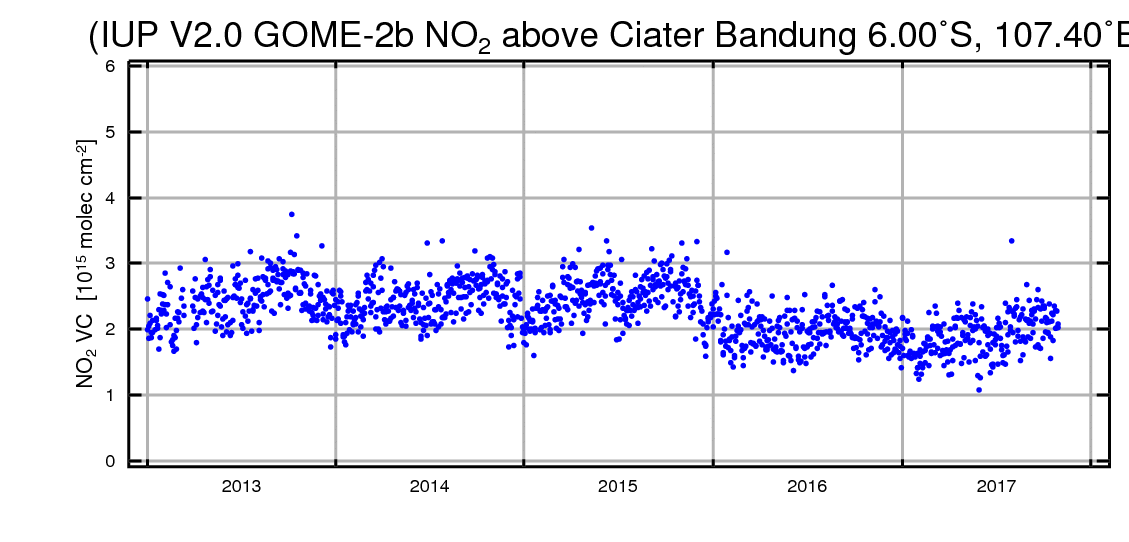
|
6.4°S | 107.4°E |
| Mahe |
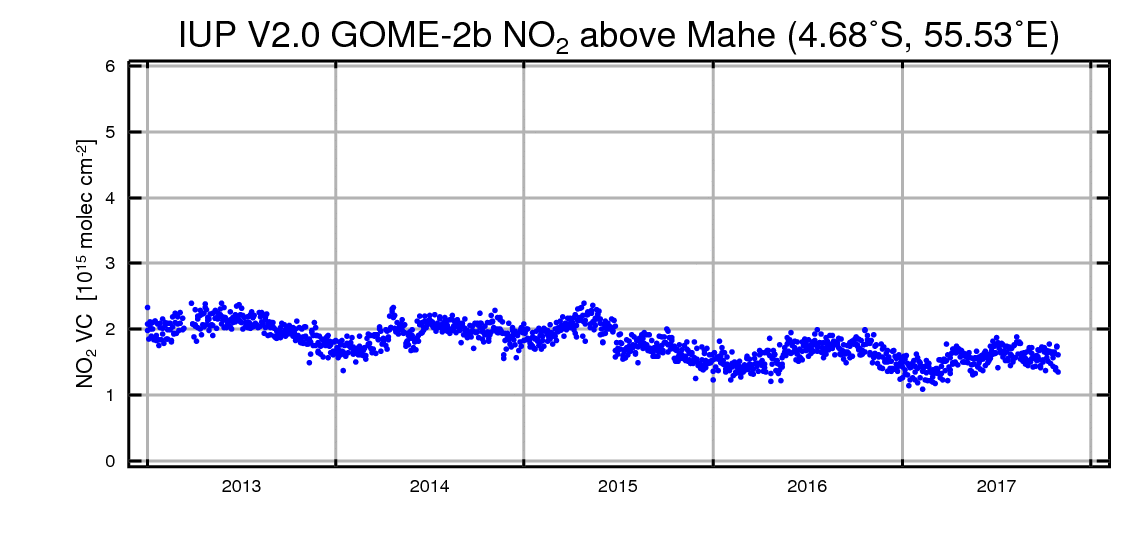
|
6.7°S | 55.5°E |
| Saint-Denis |
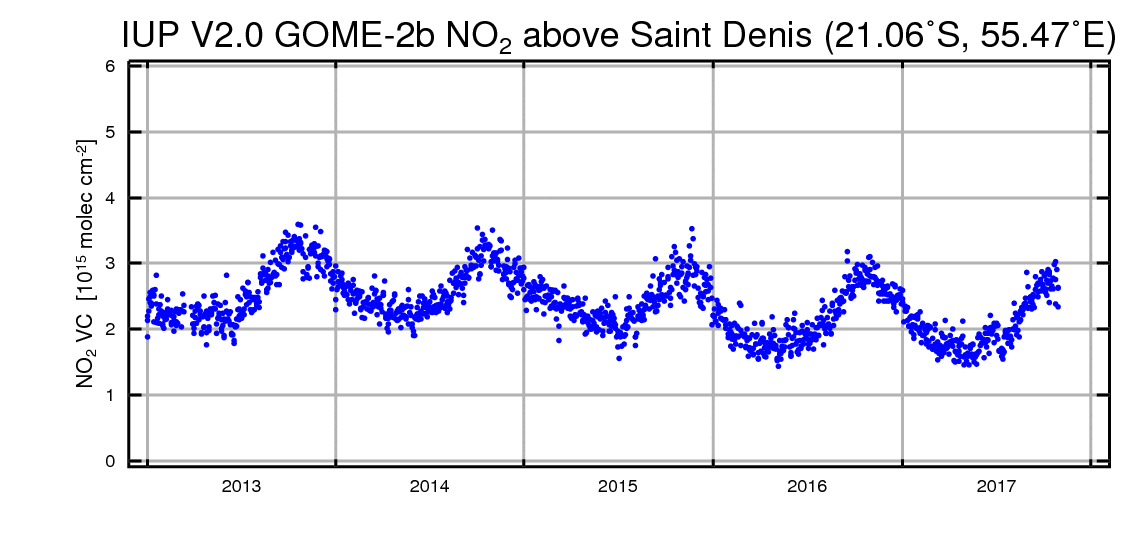
|
21.1°S | 55.4°E |
| Bauru, Brazil |
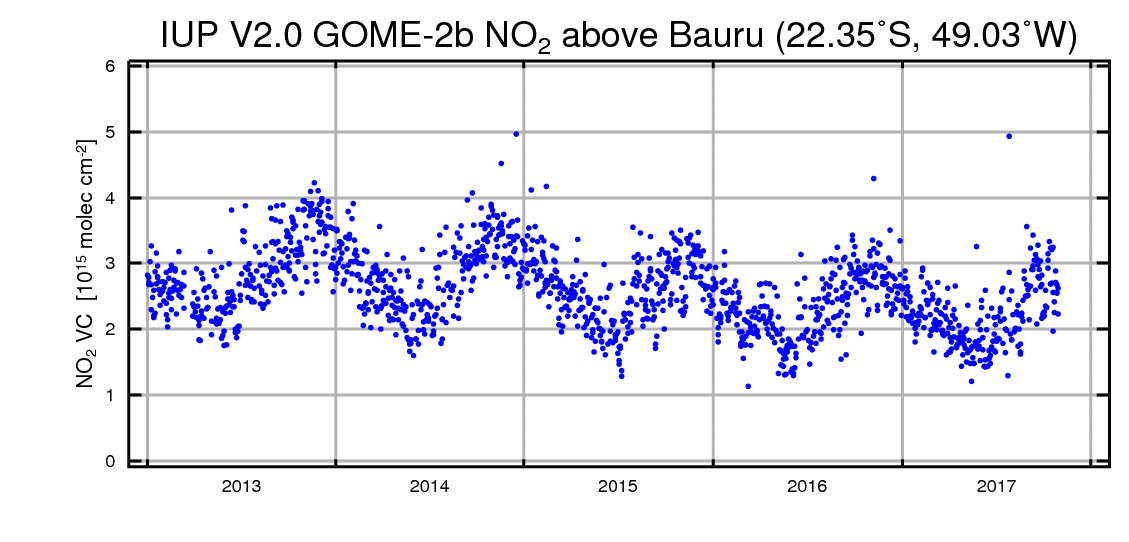
|
22.4°S | 49.0°W |
| Wollongong |
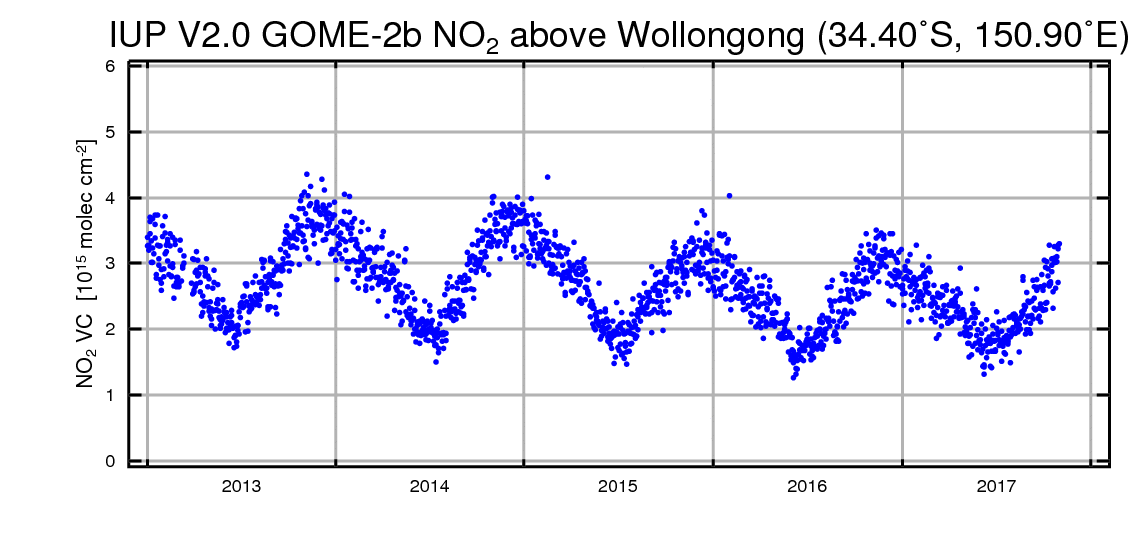
|
34.4°S | 150.9°E |
| Lauder, New Zealand |
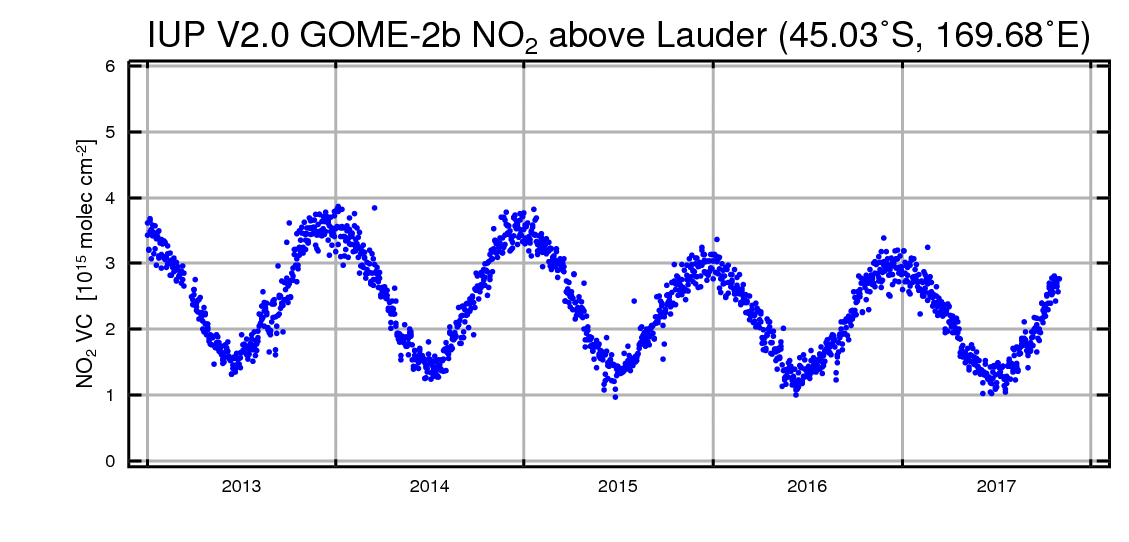
|
45.0°S | 169.7°E |
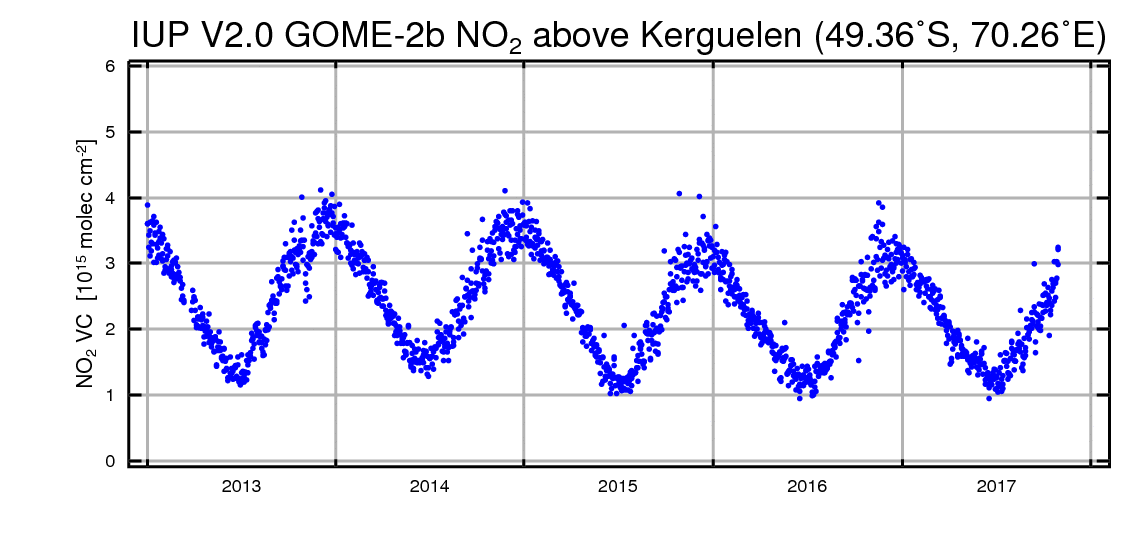
| Kerguelen Island |
|
49.4°S | 70.3°E |
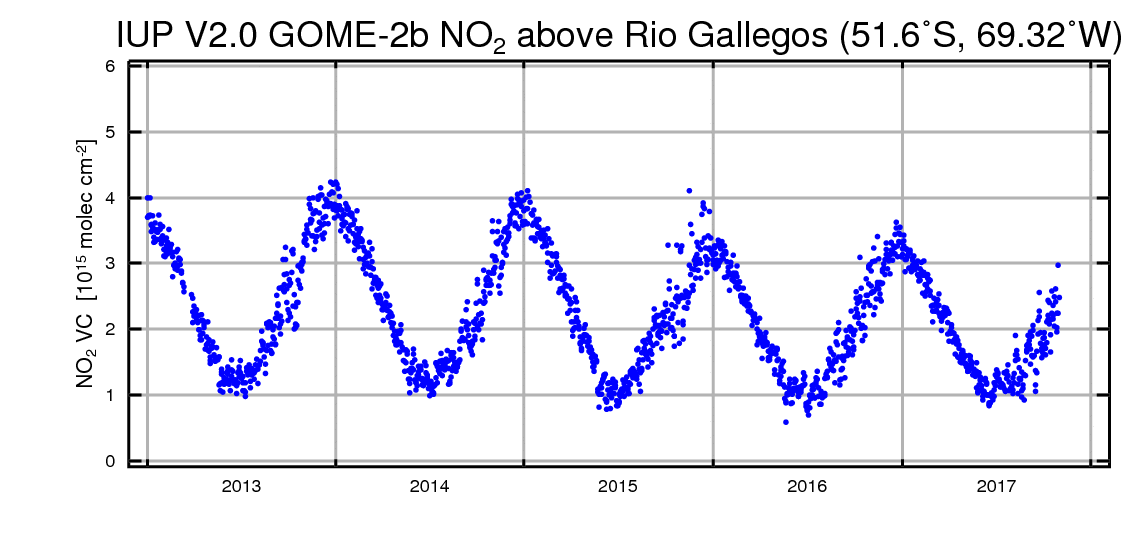
| Rio Gallegos |
|
51.6°S | 69.32°W |
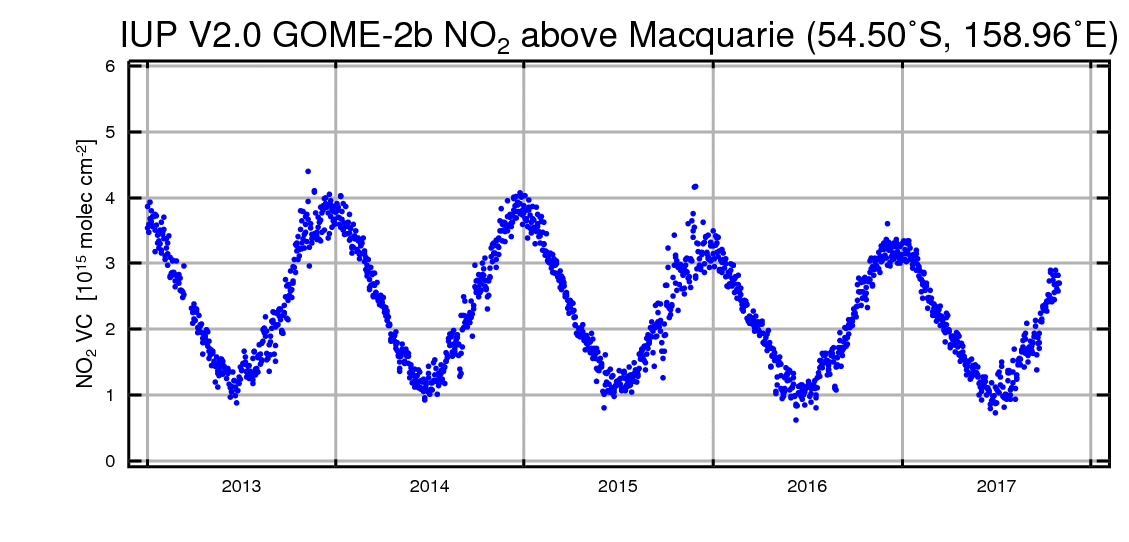
| Macquarie |
|
54.5°S | 159.0°E |
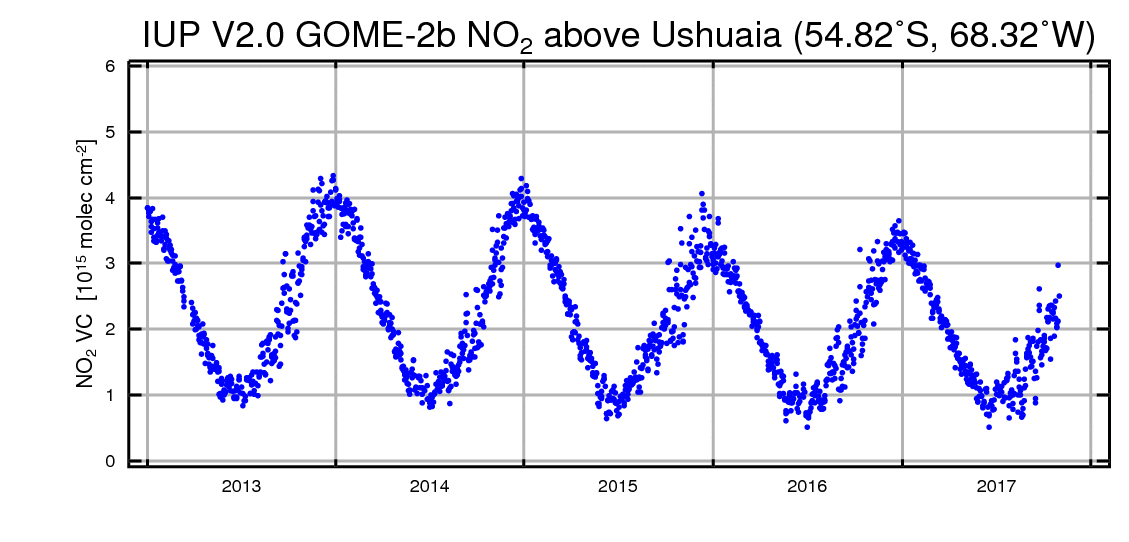
| Ushuaia, Argentinia |
|
54.82°S | 68.32°W |
| Marambio, Antarctica |
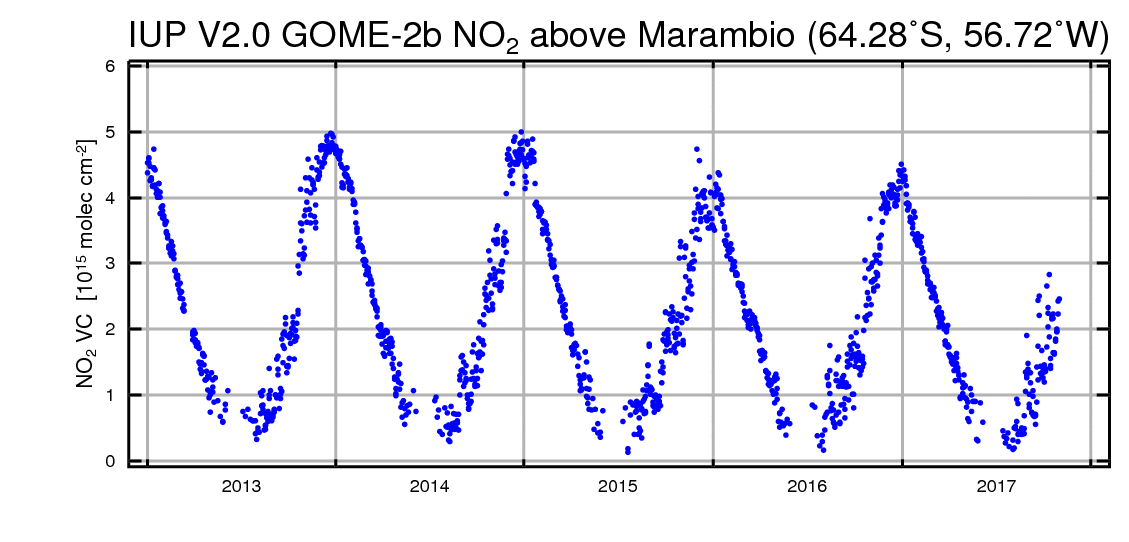
|
64.3°S | 56.7°W |
| Faraday, Antarctica |
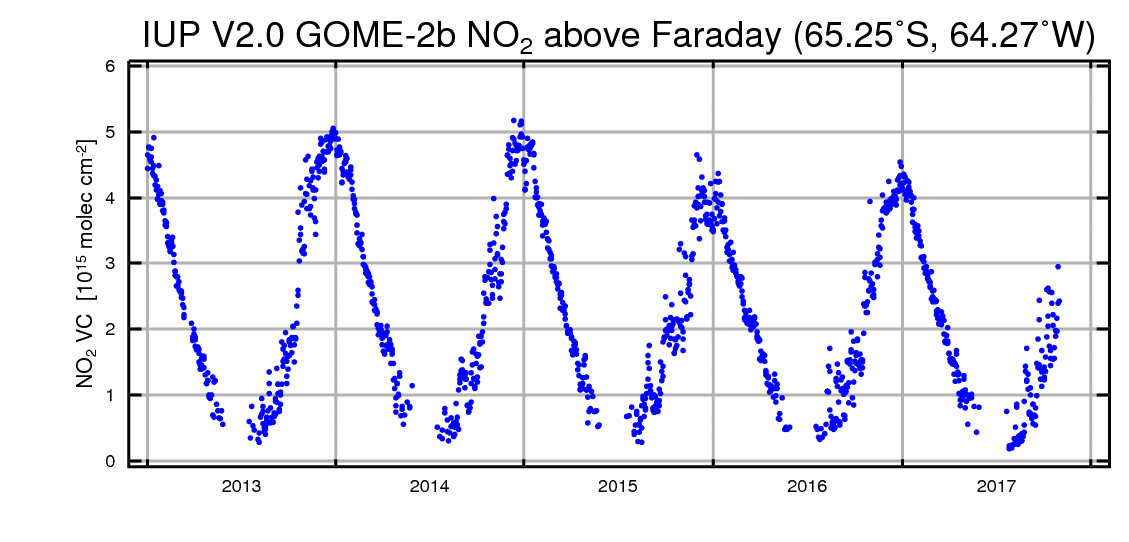
|
65.3°S | 64°W |
| Dumont d’Urville, Antarctica |
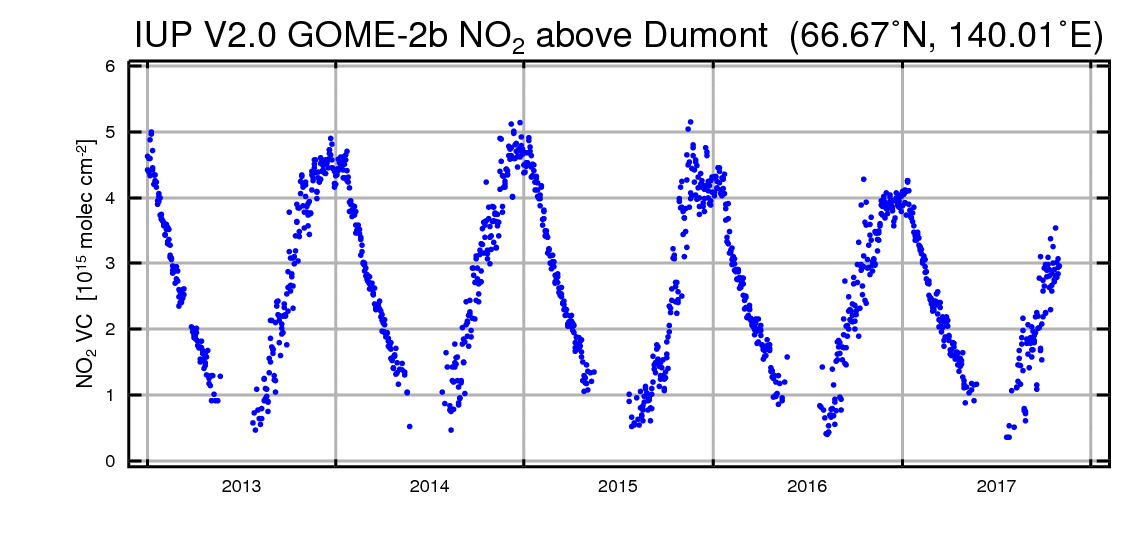
|
66.7°S | 140°E |
| Rothera, Antarctica |
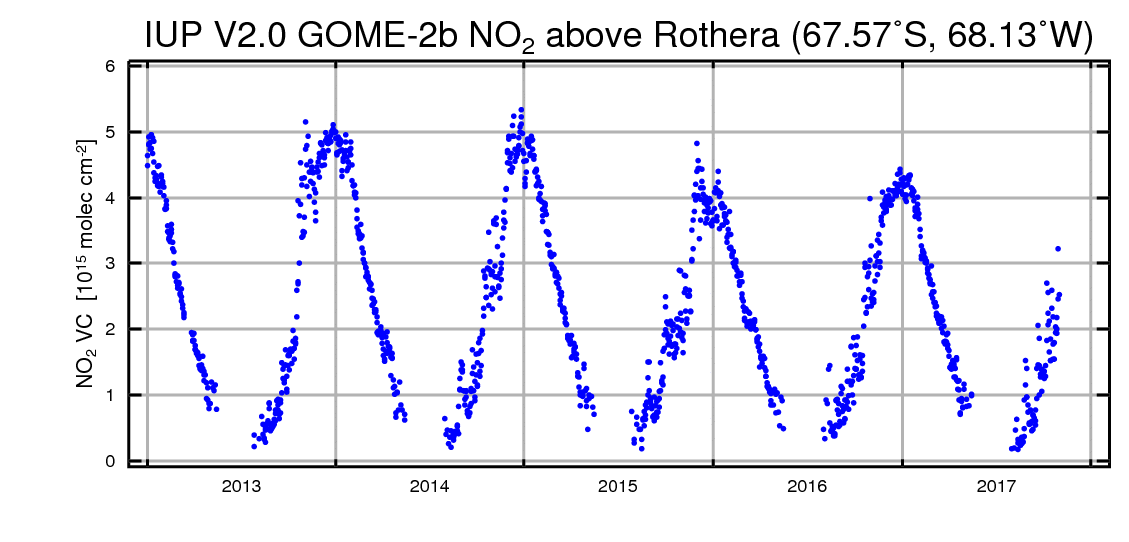
|
67.6°S | 68.1°W |
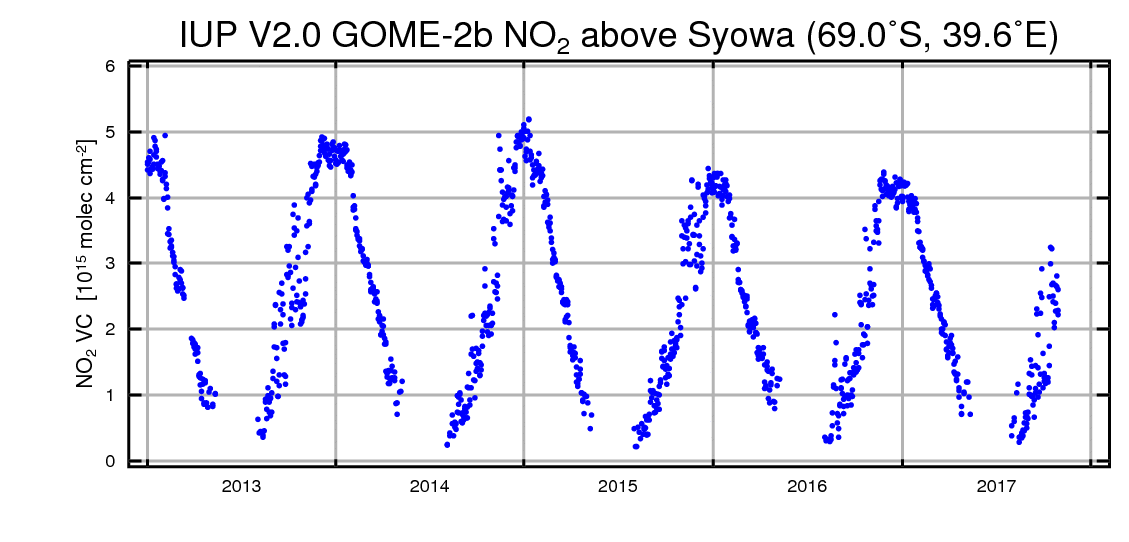
| Syowa, Antarctica |
|
69.0°S | 39.6°E |
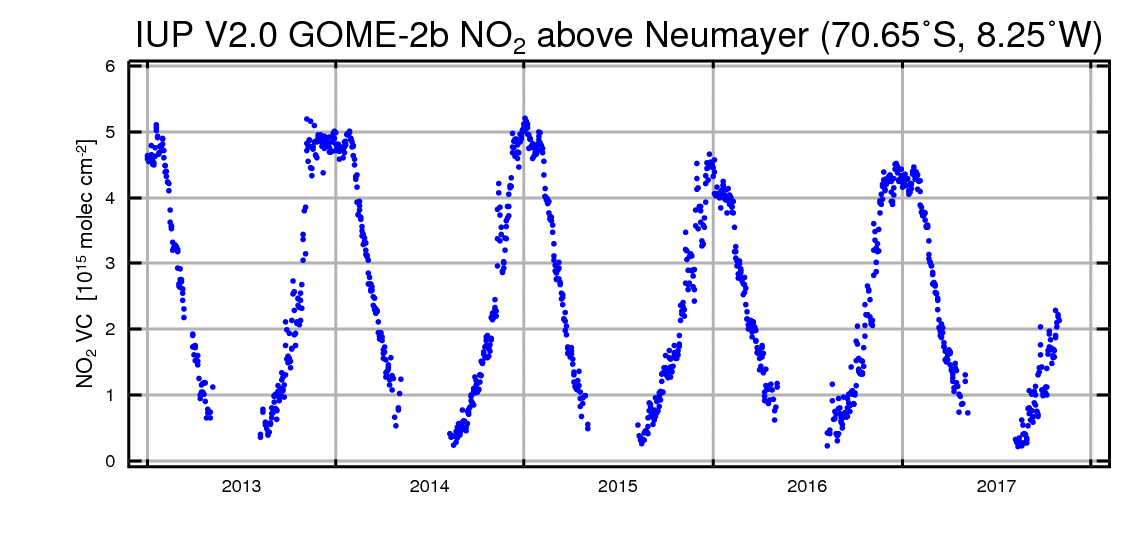
| Neumayer, Antarctica |
|
70.65°S | 8.3°W |
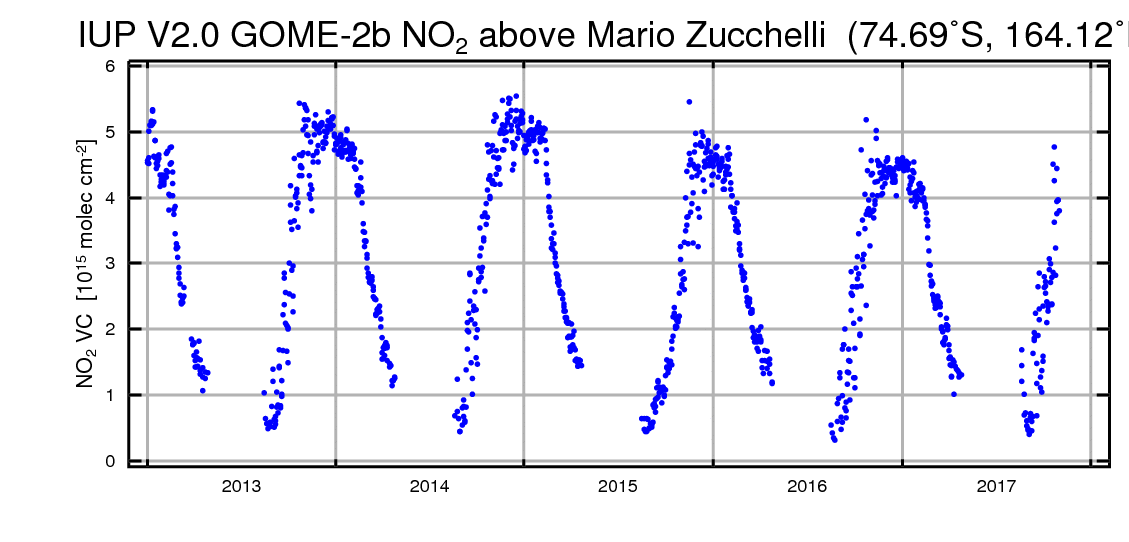
| Mario Zucchelli Station, Antarctica |
|
74.69°S | 164.12°E |
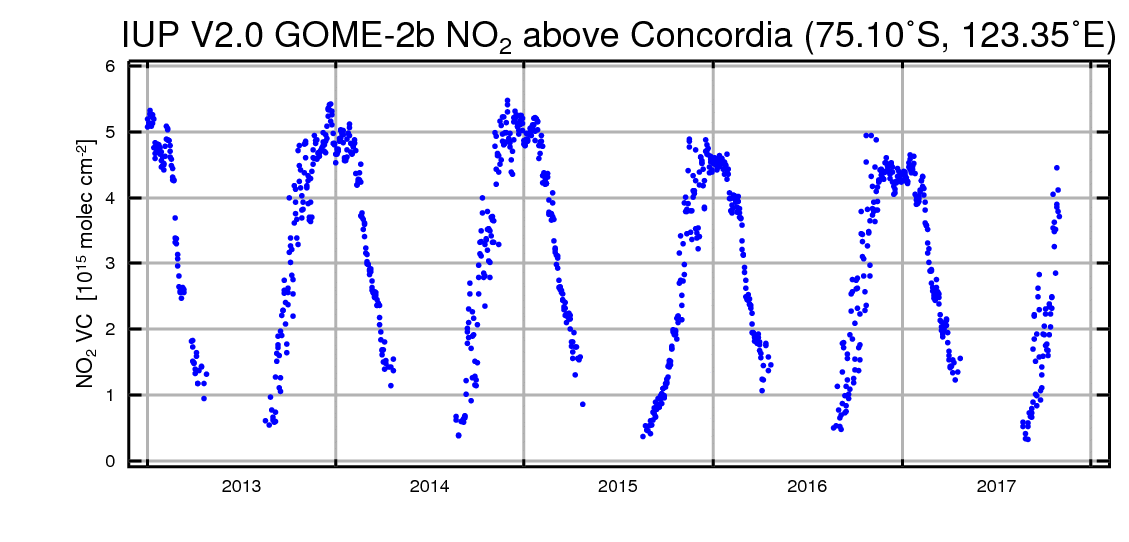
| Concordia, Antarctica |
|
75.1°S | 123.35°E |
| Belgrano, Antarctica |
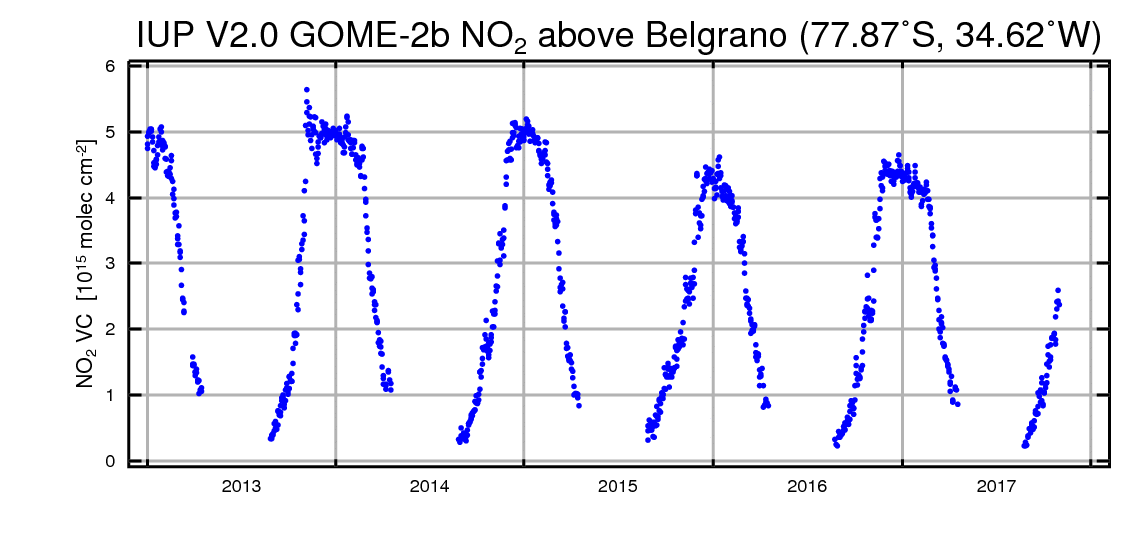
|
77.87°S | 34.62°W |
| Arrival Heights, Antarctica |
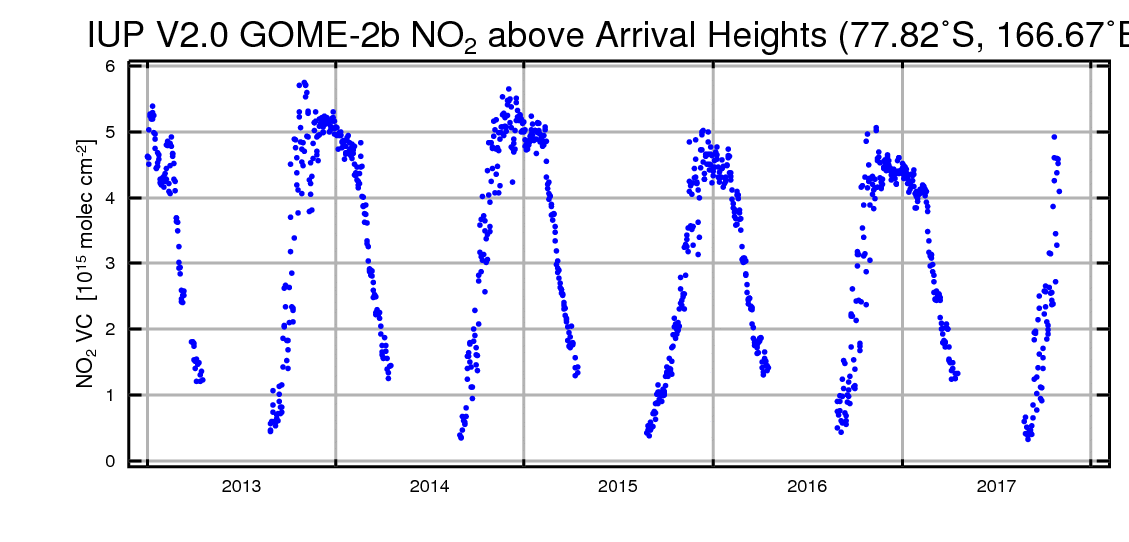
|
77.8°S | 166.7°E |
| Want more stations or updated files? Send a request to Andreas Richter. | |||
The full data set with all individual overpasses can be downloaded as a zip-file (> 300 MBytes) here.
Disclaimer:
GOME-2B NO2 columns provided on this page are a scientific product created at the University of Bremen and based on the operational lv1-spectra provided by EUMETSAT. They are not related to the operational GOME-2B lv2-products distributed by DFD/DLR that also contain NO2 columns. Although the two GOME-2B NO2 data products agree qualitatively, the differences are significant, and thorough validation will have to be performed of both products.
Only the descending part of the orbit is used in this data set to avoid complications from averaging over measurements taken at different local time. However, at high latitudes, GOME-2B has several overpasses per day and systematic changes are expected from the diurnal profile of NO2. For detailed comparison with other data sets, the full overpass files have to be used (see link below table).
The NO2 columns in the files provided on this page are total columns assuming a stratospheric profile (US standard atmosphere with the troposphere set to 0). Wherever there is substantial NO2 in the troposphere (for example in polluted regions such as Germany), the columns will exceed the real stratospheric ones and are not very accurate.
Links:
-
NO2 from GOME-2A can be found here.
-
NO2 from SCIAMACHY can be found here.
-
You might want to check our GOME NO2 page.
-
There also are tropospheric NO2 columns from SCIAMACHY available.
-
More information on GOME-2 can be found here.
-
More SCIAMACHY scientific products can be found at the IUP Bremen data archive.
-
Many SCIAMACHY related links can be found on the German SCIAMACHY page.
-
For information on the MetOp satellite and other instruments on it check the EUMETSAT MetOp pages.
Contact
If you have any questions, comments or data requests, please contact Andreas Richter.