
BrO Spectra
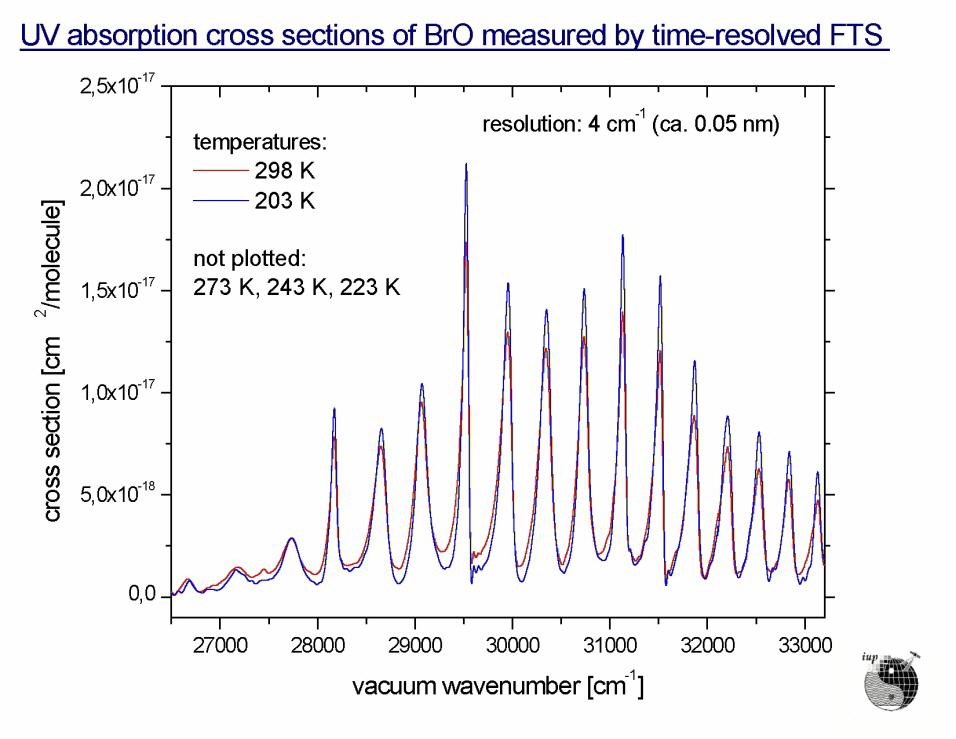
- Reference absorption cross sections of BrO for the UV spectral range recorded at five temperatures: 298, 273, 243, 223, and 203K, using a technique of Time-resolved Rapid Scan FTS (Fig.4).
- BrO was produced by means of a flash photolysis setup from the precursors Br2 and O3. A Rapid Scan FTS (BRUKER IFS 120 HR) was synchronized to the photolysis flash, thus recording dynamic interferograms. This enabled the observation of high optical densities of BrO formed shortly after the flash.
- The scaling of relative spectra to absorption cross sections was done using the results of a kinetical analysis. For this reason, additional TRFTS measurements with a temporal resolution of 0.333 ms were carried out. These experiments were modeled by a chemical simulation. As a result from the kinetical analysis, it turned out that the integrated absorption cross section over the whole band system of the observed electronic transition of BrO (A<-X) is constant over the whole temperature range. The integrated absorption cross section corresponds to the oscillator strength of the involved electronic transition. All BrO absorption spectra have been normalized to an averaged integration value. The BrO absorption spectra are calibrated in vacuum wavenumbers. Spectral resolution is 4 cm-1.
| Temperature | |
|---|---|
| 298 K | BrO_Cross_298K_Static_FTS_4cm |
| 273 K | BrO_Cross_273K_TRFTS_4cm |
| 243 K | BrO_Cross_243K_TRFTS_4cm |
| 223 K | BrO_Cross_223K_TRFTS_4cm |
| 203 K | BrO_Cross_203K_TRFTS_4cm |
Table 2. Temperature dependent BrO spectra