
O3 Spectra
- an overview over the entire spectral range (240-850 nm) at all temperatures, at 1000 mbar total pressure (Fig.1)
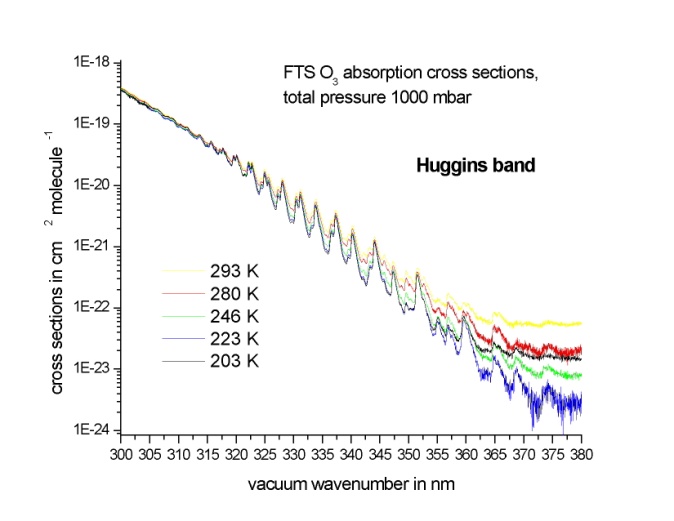
- a plot of the spectra in the Huggins bands (300-380 nm) at 1000 mbar total pressure (Fig.2)
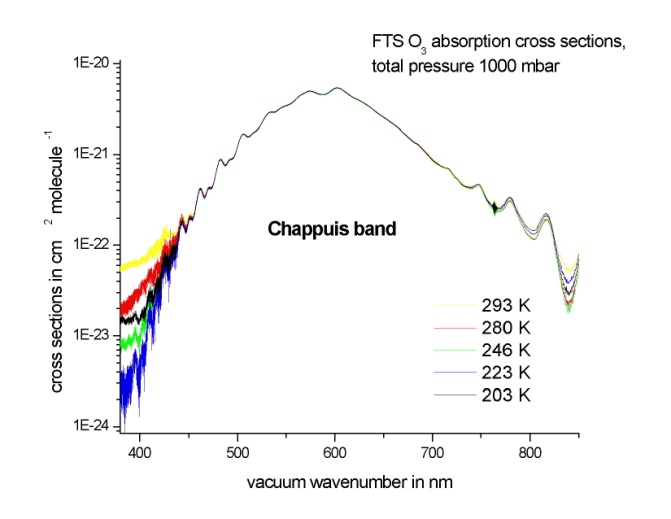
- a plot of the spectra in the Chappuis band (380-850 nm) at 1000 mbar total pressure (Fig.3)
- Temperature-dependent absorption cross-sections of O3 in the 12000-43500 cm-1 range (230-830 nm) recorded with a high-resolution Fourier-transform spectrometer, at total sample pressures of 100 and 1000 mbar (Table 1, all files are raw ASCII-data, vacuum wavenumbers)
| Temperature | Pressure 100 mbar | Pressure 1000 mbar |
|---|---|---|
| 293 K | o3_2931.dat | o3_293h.dat |
| 280 K | o3_2801.dat | o3_280h.dat |
| 246 K | o3_2461.dat | o3_246h.dat |
| 223 K | o3_2231.dat | o3_223h.dat |
| 203 K | o3_2031.dat | o3_203h.dat |
Table 1. Temperature-dependent absorption cross-sections of O3
S. Voigt, J. Orphal, K. Bogumil, and J. P. Burrows:
"The Temperature Dependence (203-293 K) of the Absorption Cross-Sections of O3 in the 230–850 nm region Measured by Fourier-Transform Spectros-copy", Journal of Photochemistry and Photobiology A: Chemistry, 143, 1–9, 2001.