
Monitoring
- Health and performance of the SCIAMACHY instrument are regularly monitored by the Sciamachy Operations Support Team (SOST).
- Monitoring activities are essential to detect and possibly correct for the degradation of instrument components. Therefore long-term monitoring is a prerequisite for a high data product quality throughout the lifetime of SCIAMACHY.
- One part of the long-term monitoring activities is the trend analysis of measurements with the internal White Light Source (WLS) and of observations of the unobscured Sun above the atmosphere. In order to monitor the different SCIAMACHY light paths solar measurements are taken in various viewing geometries: In limb/occultation geometry (via ASM and ESM mirrors), in nadir geometry (via the ESM mirror through the subsolar port), and via the so-called calibration light path involving the ASM mirror and the ESM diffuser.
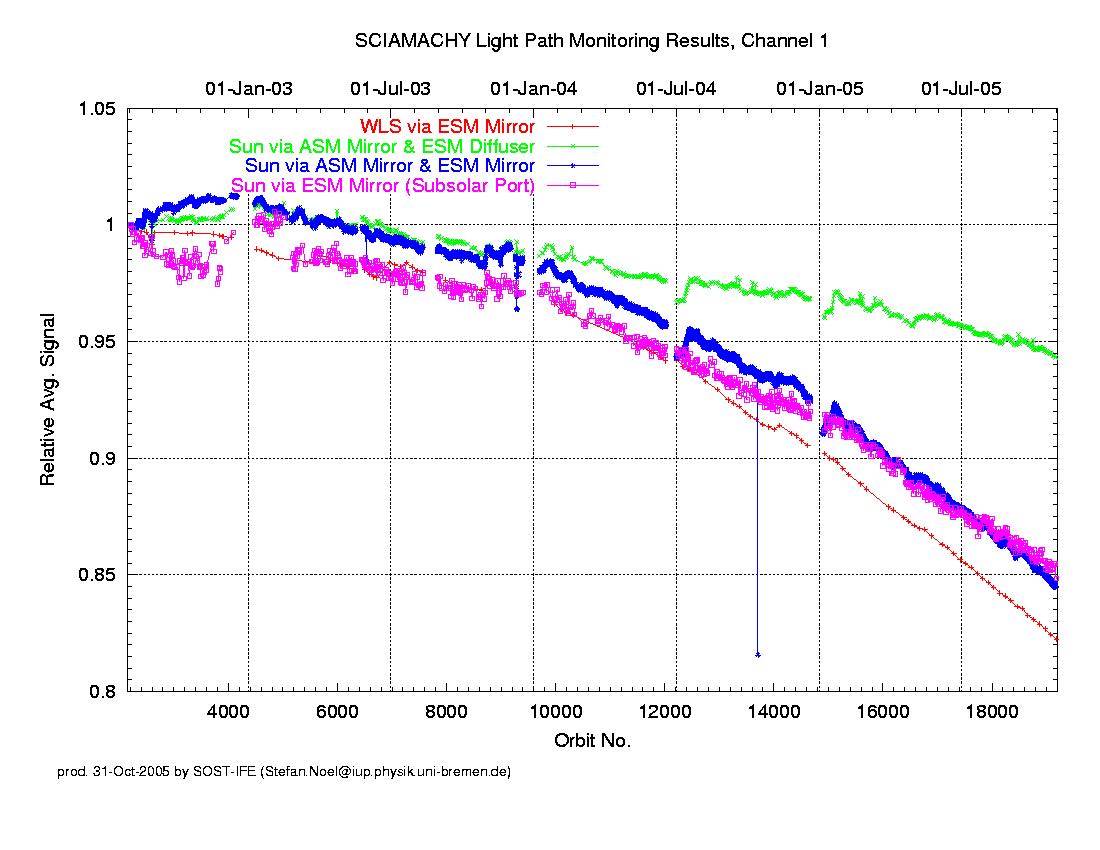
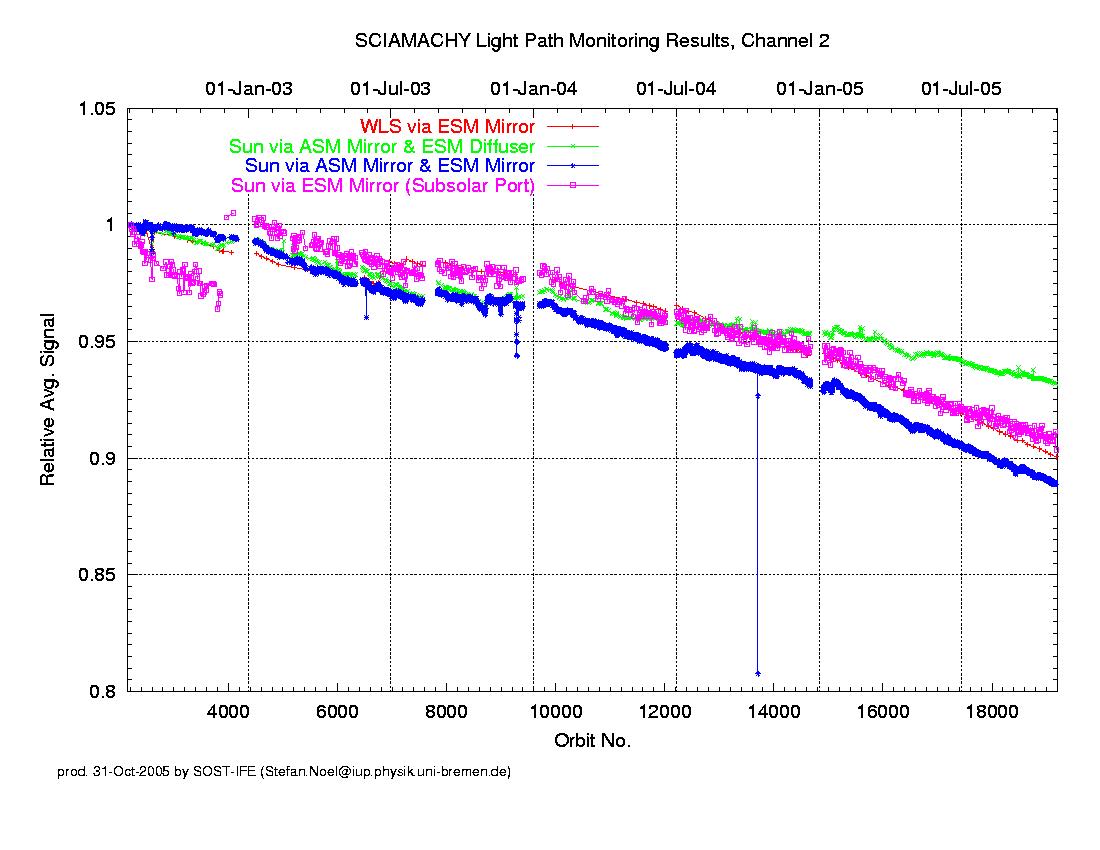
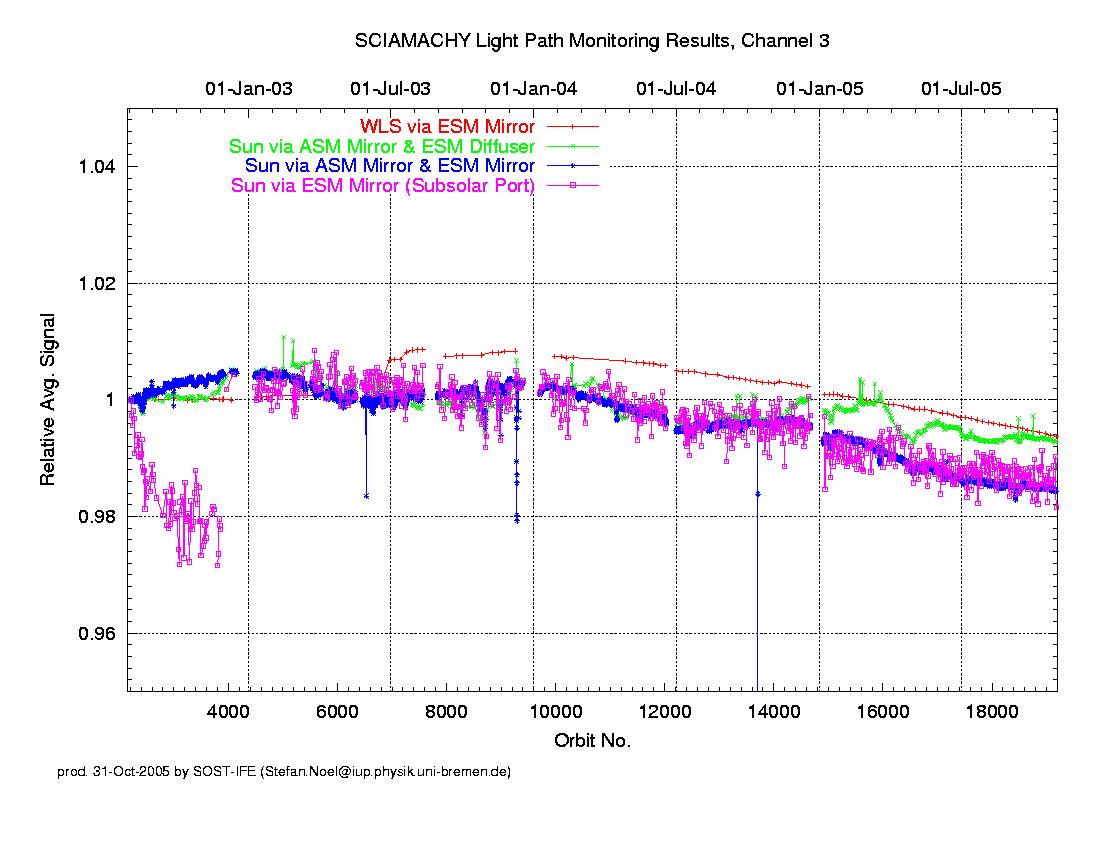
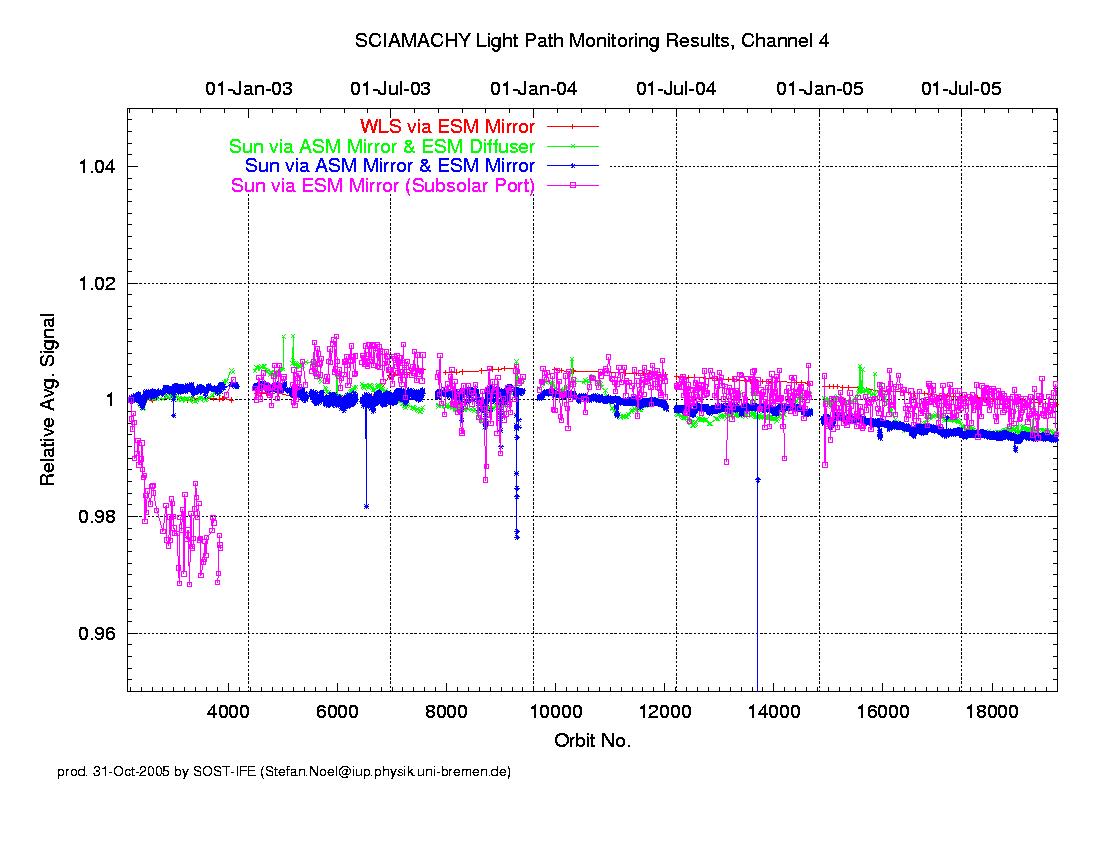
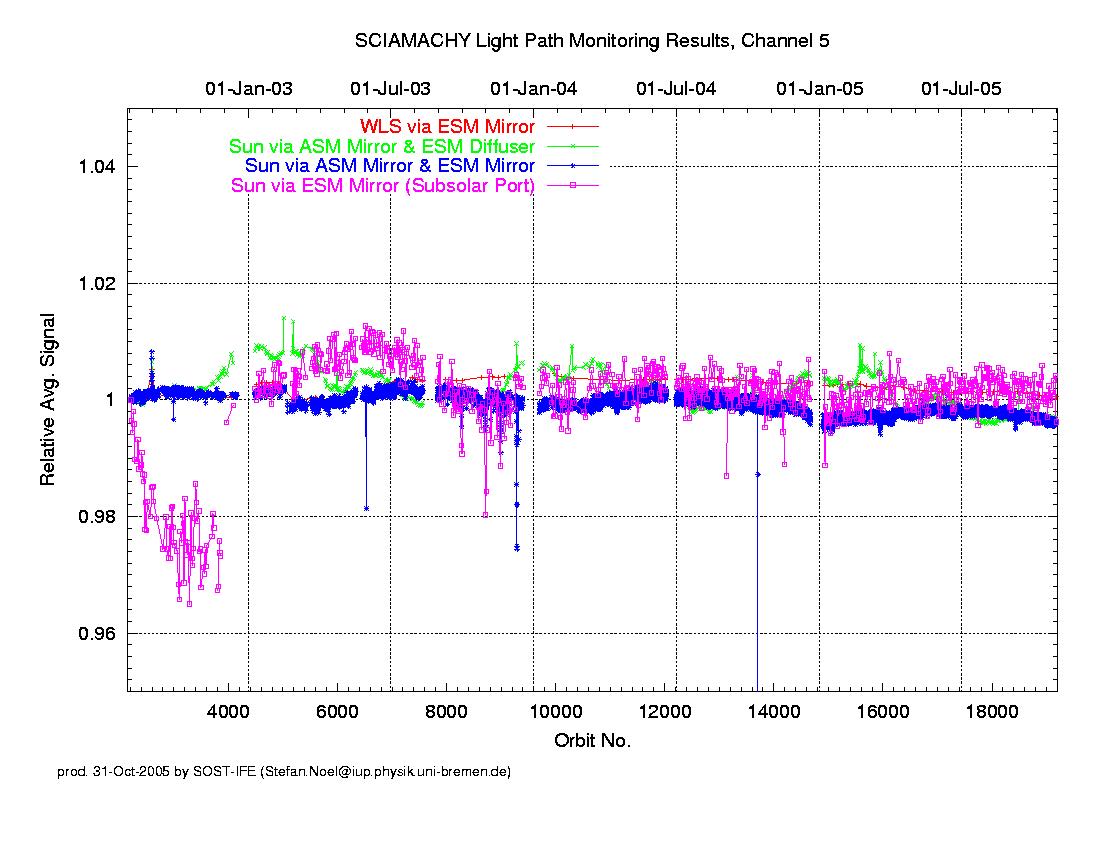
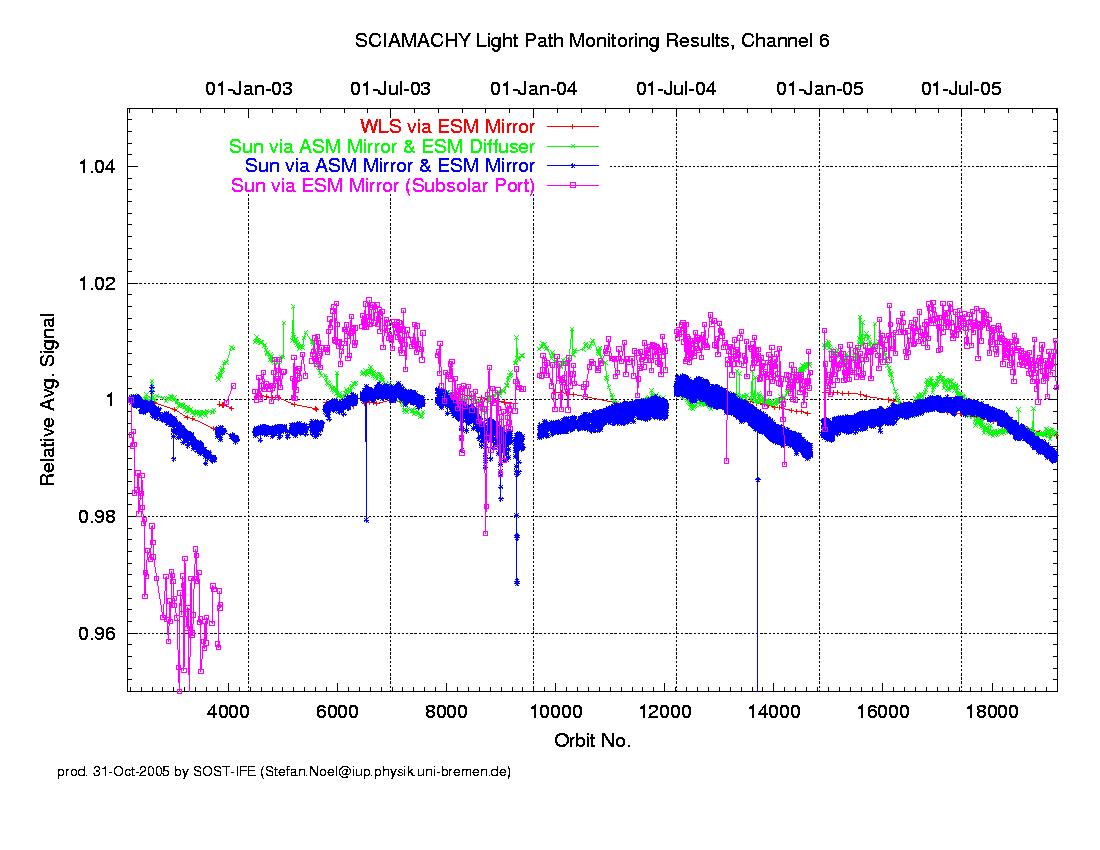
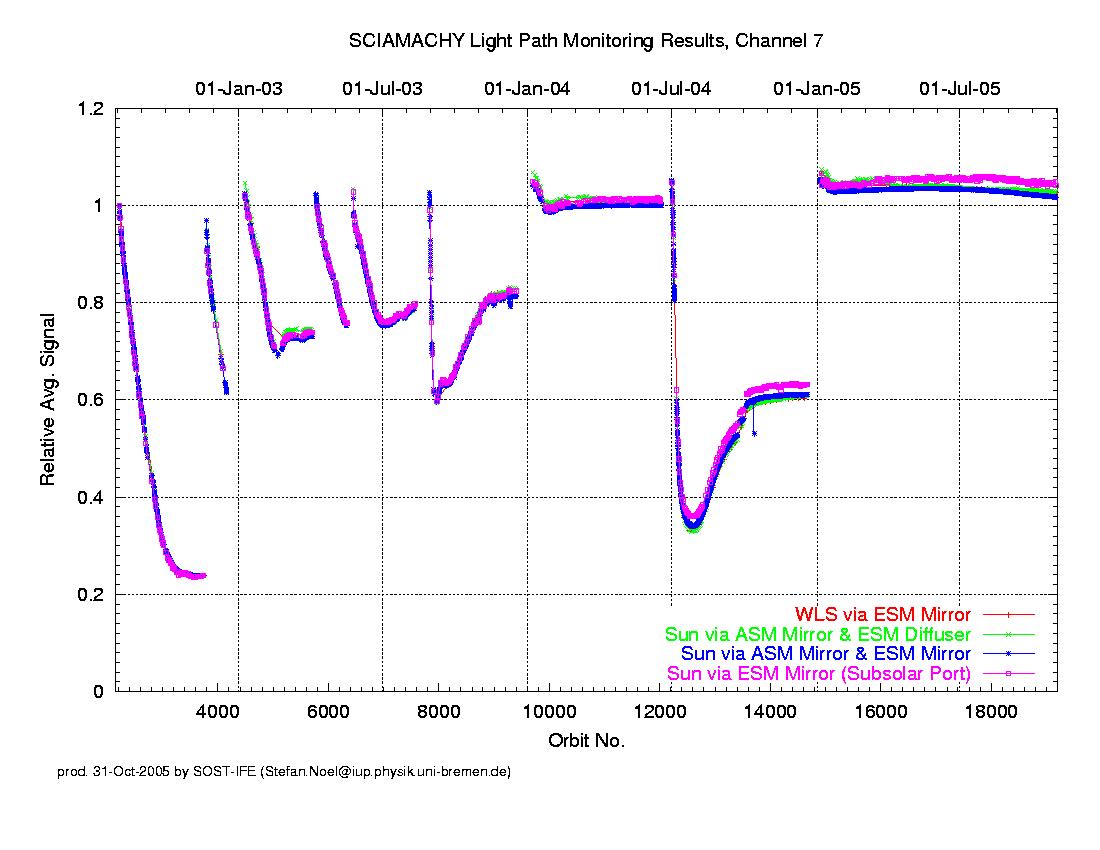
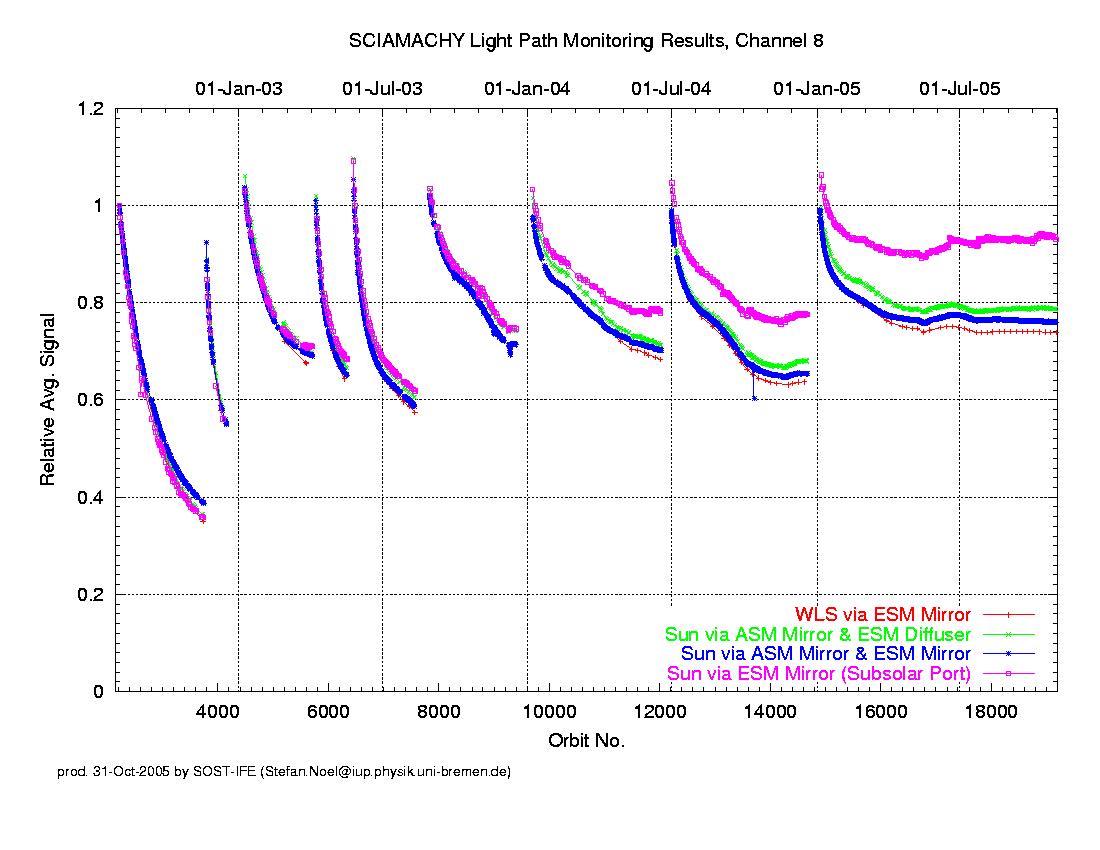
- SCIAMACHY long-term monitoring comprises a regular analysis of these measurements. The plots displayed on this page show first results of these monitoring activities. All measured signals have been averaged over the entire channel and then divided by the corresponding measurement at a reference time (currently 2 August 2002, at about orbit 2200), yielding an effective instrument throughput for the different light paths. Note that measurements performed during times of reduced instrument performance (e.g. switch-offs or decontamination periods) have been omitted.
- The plots are updated on a daily basis, thus reflecting the current status of the instrument.
- Monthly long-term monitoring plots are also available (click here).
- First spectrally resolved throughput monitoring results (based on Level 0 data) can be found here.
- First PMD monitoring results can be found here.
| Channel 1 (Click to Enlarge) | Channel 2 (Click to Enlarge) |
|
|
| Channel 3 (Click to Enlarge) | Channel 4 (Click to Enlarge) |
|
|
| Channel 5 (Click to Enlarge) | Channel 6 (Click to Enlarge) |
|
|
| Channel 7 (Click to Enlarge) | Channel 8 (Click to Enlarge) |
|
|
- As can be seen from the plots, the SCIAMACHY instrument is generally in good shape. However, to avoid misunderstanding, some features in the plots require additional explanation:
- General remark: The results presented here are based on the analysis of uncalibrated (Level 0) data, which have been corrected for dead/bad pixels, dark current, scan angle dependencies, quantum efficiency changes, and the seasonally varying distance to the Sun. Additional calibration steps have not been performed, like for example a straylight correction. Therefore, variations smaller than about 1% require careful investigation.
- The timing of subsolar measurements before 30 November 2002 (about orbit 3922) did not consider the known yaw misalignment of SCIAMACHY on ENVISAT. This is the reason for the deviations of the average subsolar signal from the other light paths before this time.
- The timing has been corrected in the final flight settings. To take this change into account, all subsolar measurements after 30 November 2002 have been referred to orbit 4519 (10 January 2003, just after a long decontamination phase).
- Between 21 and 27 February 2003 the detector temperature settings have been slightly changed. This explains small jumps in the average signals at about orbit 5140 (especially visible in channel 1 for subsolar measurements).
- The WLS has proven to be radiometrically very stable except for a degradation in the UV which is correlated with the burn time.
- In the UV (channels 1 and 2) a small degradation is visible for all light paths. However, this degradation is much smaller than expected from e.g. GOME experience.
- Most prominent are the large throughput changes in the IR channels 7 and 8. The decrease in throughput is caused by growing ice layers on the detectors. The ice can be removed by heating during a decontamination procedure such that the full throughput is restored, but then the ice layers start to grow again.
- Variations of the measured average solar signal are often correlated with solar activity. Especially, this can be seen in the "Sun via ASM Mirror and ESM Mirror" data, which have the best temporal resolution.
- The (end of the) partial solar eclipse of 31 July 2003 shows up in the monitoring plots as a slight decrease of the "Sun via ASM Mirror and ESM Mirror" signal. This signal drop is not visible in the other data, because there were no corresponding measurements for the other light paths at the time of the eclipse.
- A similar (but larger) effect is visible during the partial solar eclipse of 14 October 2004.
- The "Sun via ASM Mirror and ESM Mirror" data for 9 and 10 December 2003 are affected by the reduced ENVISAT pointing performance during this time.
- Contact: Stefan Noël (stefan.noel@iup.physik.uni-bremen.de)