

2016 - 2017
December 2017:
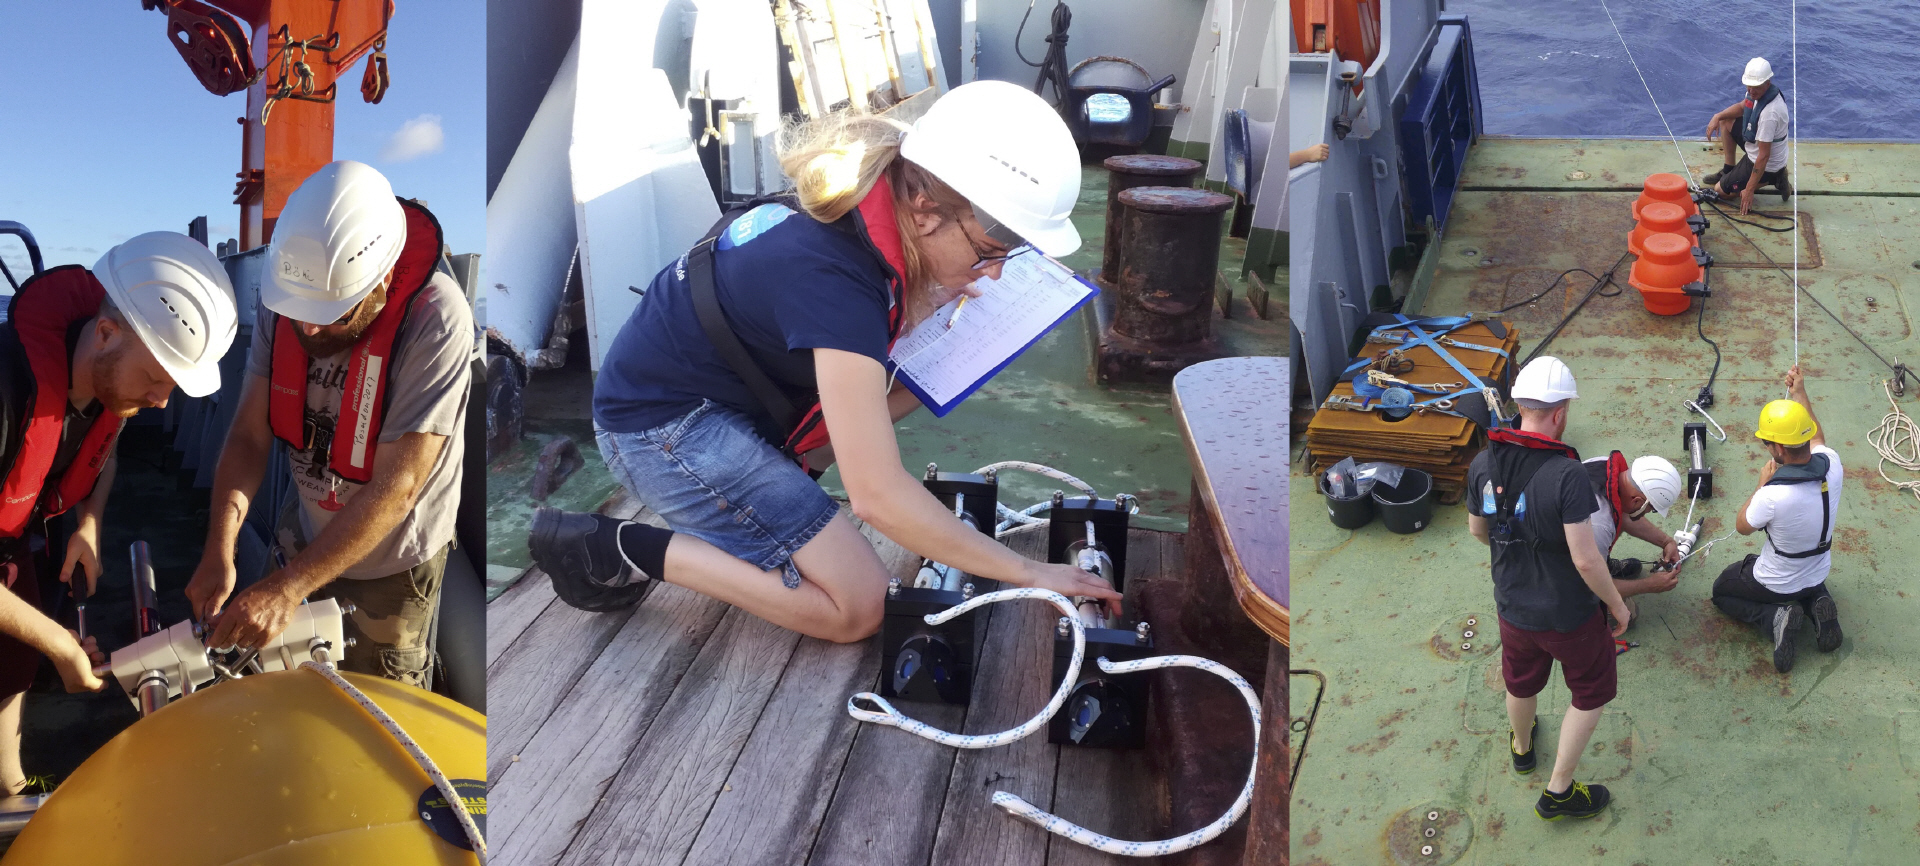
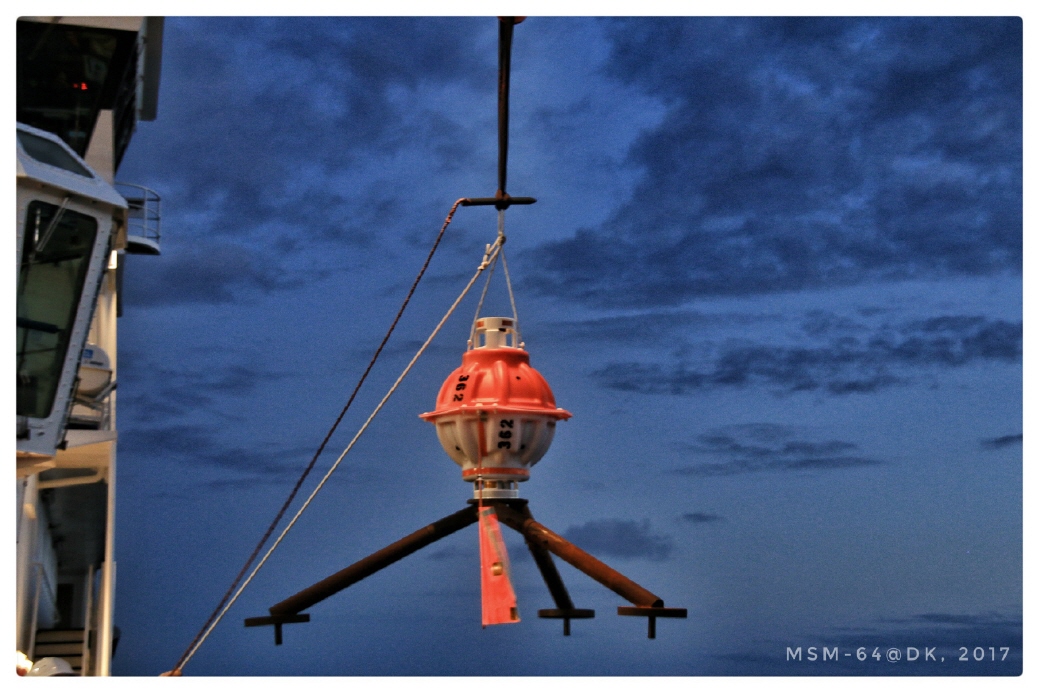
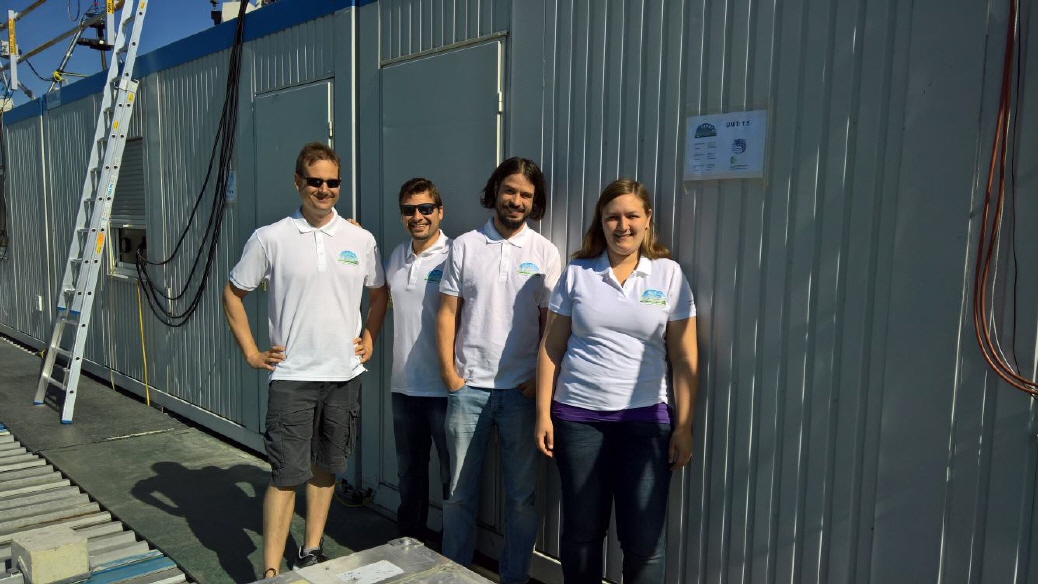
Cruise 516 of the research vessel “Poseidon”
Text: Maren Walter, Christian Mertens
Photos: Florentina Münzner, Simon Rümmler
The cruise 516 of the research vessel Poseidon is part of the observational program of the Collaborative Research Center TRR 181 “Energy Transfers in Atmosphere and Ocean” (www.trr-energytransfers.de). During the three week cruise in July/August 2017 that started and ended in Ponta Delgada on the Azores, nine scientist and students from the Universities of Bremen and Hamburg were on board. The objective of the cruise was to measure energy fluxes along a tidal beam that emanates from the seamounts south of the Azores.
Waves and currents in the ocean are driven by winds and tides. These motions occur on all scales, ranging from basin wide currents to the millimeters of turbulence. The interaction between the different scales and the exchange of energy is not well understood. For example, tidal forcing at seamounts and continental shelves generates internal waves that could travel hundreds of kilometers through the ocean basins before they eventually disintegrate and dissipate. Their loss of energy is determined by a number of different processes and interactions, but the where and how of these processes is largely unknown. In project W2, we aim to better understand the propagation and dissipation of tidal energy in the oceans’ interior with the goal to better implement these processes in climate models.
To measure the internal wave energy fluxes, several time series stations were occupied along the tidal beam identified from satellite altimetry prior to the cruise. Each station lasted between 36 and 48 hours to observe the variability of currents and density associated with the semidiurnal as well as the diurnal tides. First results show a clear signal of the internal waves. The amplitude of the waves has a maximum between 800 m and 1300 m water depths, where the vertical excursions of the isopycnals are exceeding 100 m. To observe long-term temporal variability of the energy flux, a mooring was deployed within the tidal beam. It is equipped with current meters and temperature logger to record energy fluxes and their variations over the course of one year. It will be recovered during the next cruise in May 2018.
November 2017:
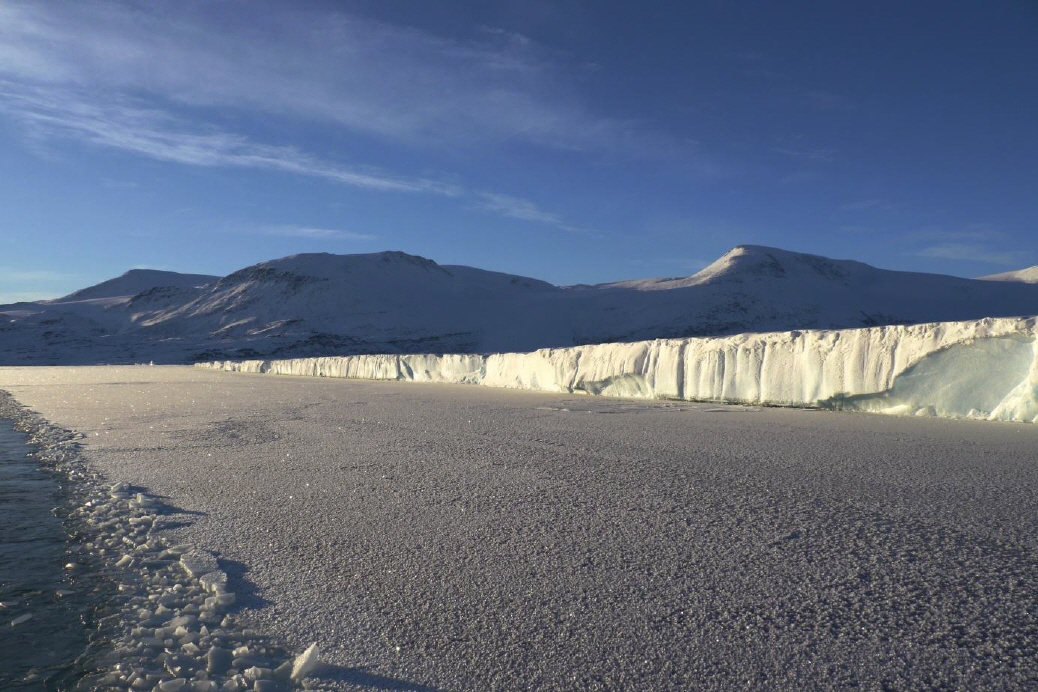
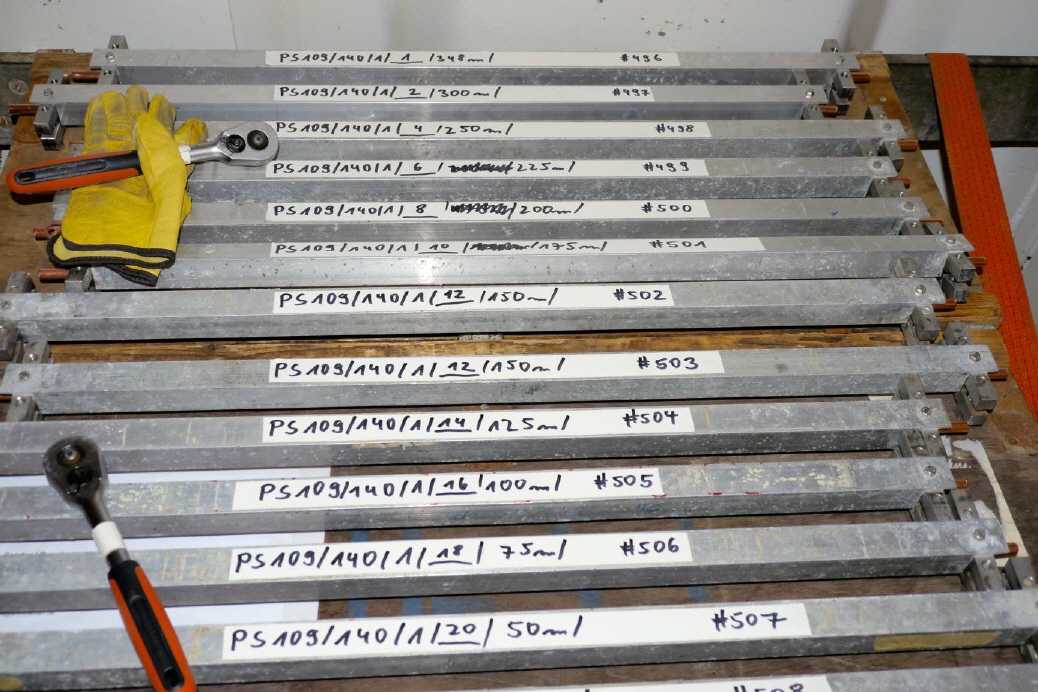
The strong temperature increase in the Nordic Seas causes the Greenland Glaciers to melt. In September and October 2017, members of the Department of Oceanography participated in an expedition on board the RV Polarstern. The objectives were to increase our understanding of the interaction between Arctic Ocean and Greenland Ice Sheets and Glaciers and to quantify the amount of glacial melt water flowing into the ocean. They took hundreds of seawater samples on the northeast Greenland shelf in front of the 79-Degree-North and the Zacharias Glacier. The samples will later be analyzed for the amount of helium and neon at the IUP noble gas lab. These trace gases allow to directly quantify the amount of glacial melt water in the ocean.
Text: Dr. Oliver Huhn, IUP, Bremen
Fotos: Dr. Tilia Breckenfelder, IUP+Marum, Bremen
October 2017:
Forschungsmeile 2017
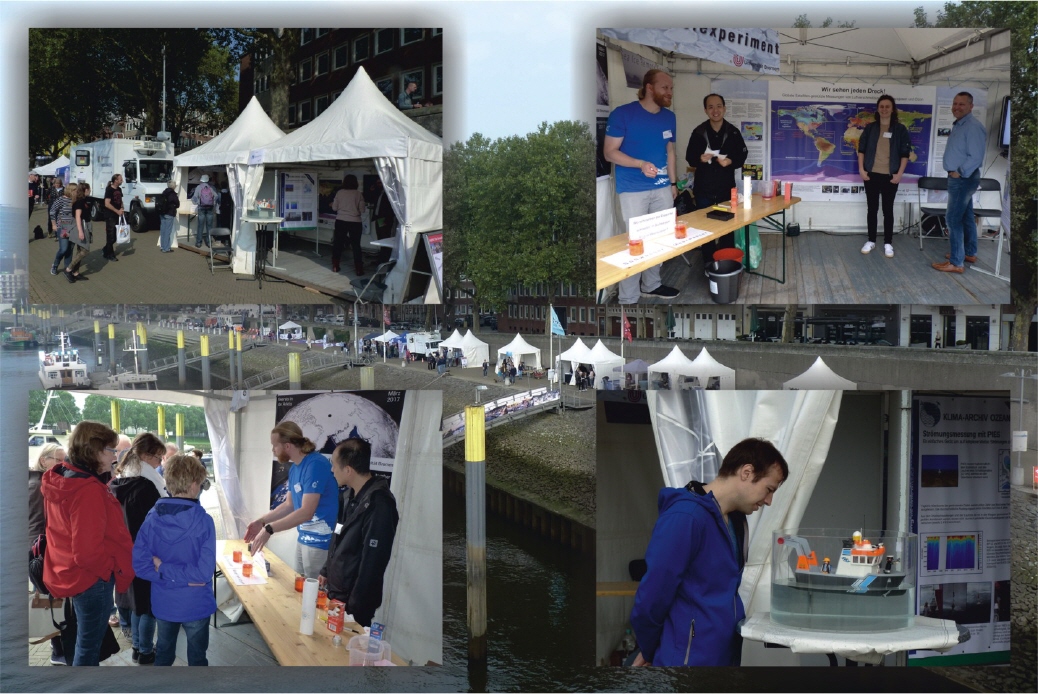
This year, IUP participated again at the ‘Forschungsmeile’ during the ‘Maritime Woche 2017’ in Bremen. The working groups Physics and Chemistry of the Atmosphere, Remote Sensing and Oceanography presented on 23 and 24 September close to the Weser at the ‘Schlachte’ their current research areas to the public. Visitors could observe on-site measurements of air quality by the IUP mobile measurement truck. A specific highlight was the ‘Ice cube experiment’, which answered the question: Does an ice cube melt faster in fresh water or (salty) seawater? The possibly surprising answer is: In fresh water.
The explanation is that the cold melt water from the ice cube has a lower density, i.e. is lighter, than the salty seawater. It therefore builds a layer above the seawater, which keeps the ice cube cool. In fresh water, the cold melt water sinks down and mixes with the warmer fresh water. The ice cube therefore always stays in direct contact with warm fresh water and melts faster. Similar stratification is seen in the Arctic: Warm, more salty Atlantic water is separated from sea ice by a layer of fresh surface water.
Contact Gunnar Spreen (gunnar.spreen@uni-bremen.de) for more information on this topic.
September 2017:
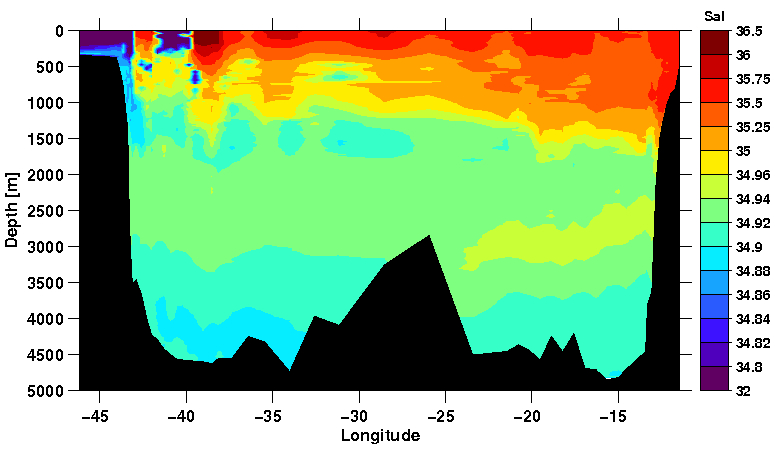
On this year’s cruise with the German research vessel Maria S. Merian, the IUP oceanography group continued to investigate the circulation and water mass transport in the subpolar North Atlantic. For this purpose, pressure inverted echo sounders (PIES) have been deployed along an east-west section following 47°N. These instruments are located at the ocean bottom and measure the sound travel time up to the surface and back to the instrument. As the sound velocity depends on temperature and salinity of the sea water, it is possible to infer these quantities as well as the density of the water from the PIES. Knowledge of the density field in turn allows the calculation of oceanic velocities and transports.
The PIES measurements in the western basin of the Atlantic already allowed to calculate the strength of the North Atlantic Current, which transports warm, saline waters from the subtropics into the subpolar North Atlantic and also influences the climate in north western Europe. This year for the first time, PIES have been deployed in the eastern basin of the Atlantic along 47°N. There they will also allow to quantify the exchange of warm and salty subtropical water and colder, fresher subpolar water masses.
On the Merian cruise that took place in May/June this year, the Bremen oceanography group was supported by colleagues from the German hydrographic institute and two Canadian students from the Arctrain research training program.
August 2017:
Global data sets on marine phytoplankton diversity at highest spatial and temporal resolution via the synergistic exploitation of hyper-and multispectral satellite data
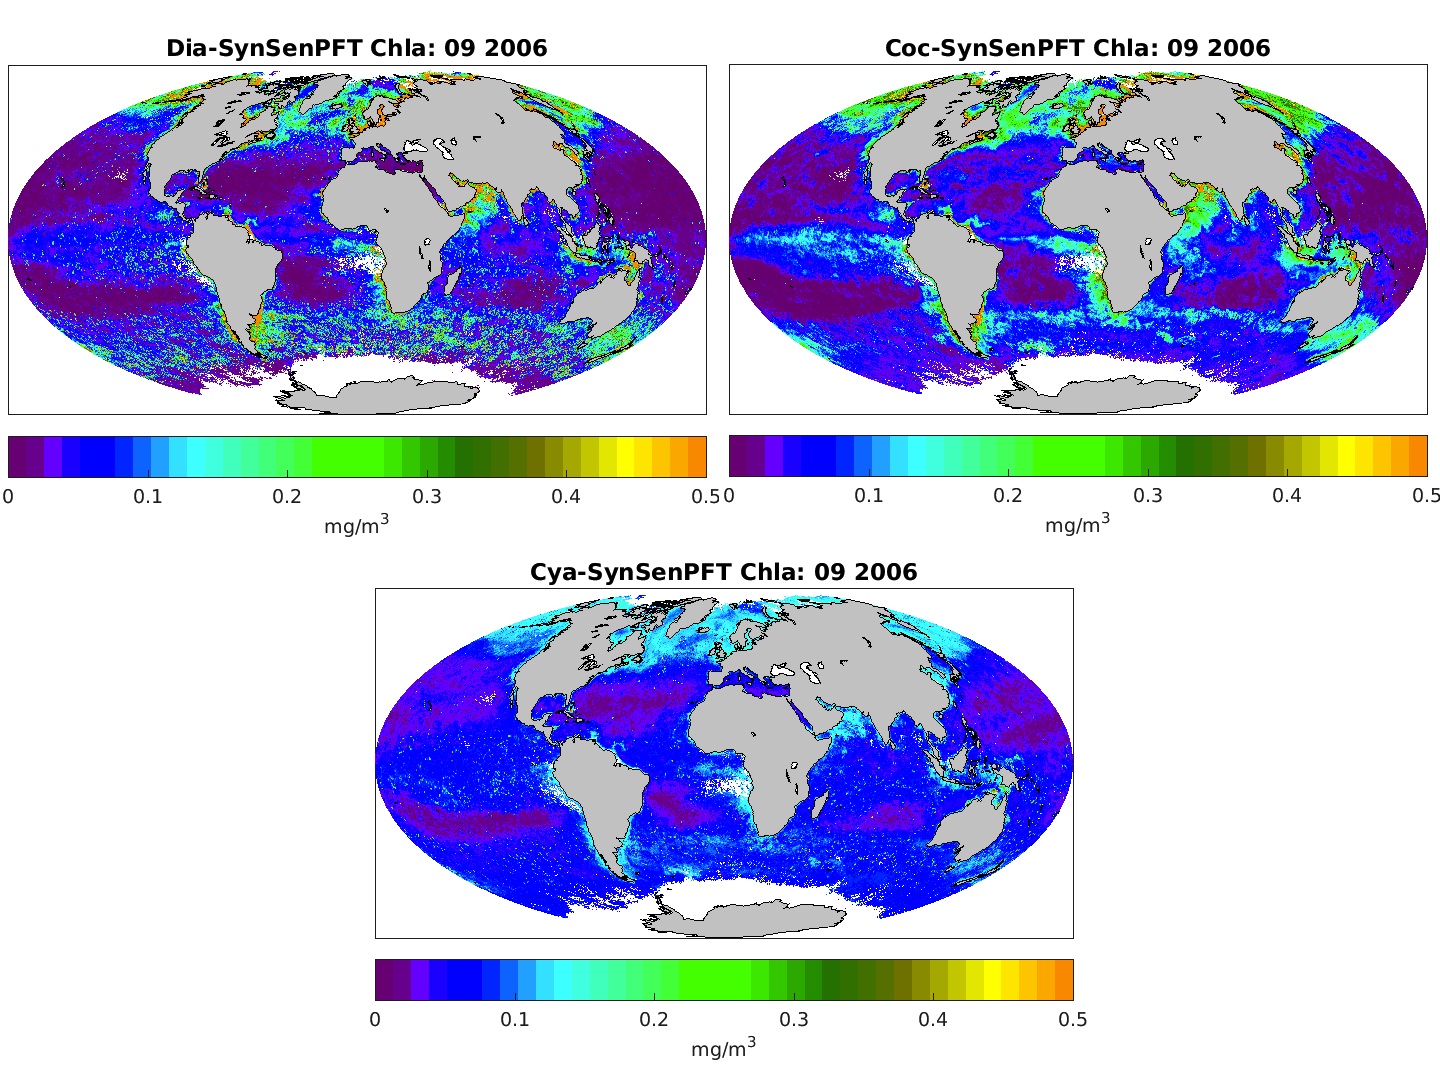
Led by the AWI research group PHYTOOPTICS in collaboration with the IUP-UB, the Laboratoire d’Océanographie de Villefranche (LOV), Villefranche, France, and the Plymouth Marine Laboratory (PML), Plymouth, United Kingdom, satellite data products of the biomass (given as chlorophyll-a) of three major phytoplankton groups, namely diatoms, coccolithophores and prokaryotic phytoplankton (also called cyanobacteria), at best have been developed within the project SynSenPFT funded under the ESRIN/ESA within the SEOM (Sceintific Exploration of operational missions) - Sentinel for Science Synergy (SY-4Sci Synergy)" programme. SynSenPFT product are publicly available for the global ocean at daily, 4km x 4km resolution for the entire ENIVSAT mission time and the image shows the SynSenPFT products for the global ocean in September 2006.
To gain knowledge on the role of marine phytoplankton in the global marine ecosystem and biogeochemical cycles, information on the global distribution of major phytoplankton functional types (PFT) is essential. Products representing phytoplankton diversity have been developed by various algorithms mostly applied to multispectral satellite data. However, despite providing a good spatial resolution and coverage, those products are limited to either only indicating size fractions or the dominance of phytoplankton groups and all these products have a strong linkage to a-priori-information because the small number of wavelength bands and the broadband resolution of these sensors provide only limited information on the difference of the phytoplankton absorption structures. Former and current satellite instruments with a very high spectral resolution provide the opportunity for distinguishing more accurately multiple PFTs using spectral approaches as has been demonstrated with the Phytoplankton Differential Optical Absorption Spectroscopy (PhytoDOAS) method (developed by the AWI PHYTOOPTICS group in collaboration with IUP-UB) in the open ocean using hyperspectral satellite data from the sensor “SCanning Imaging Absorption Spectrometer for Atmospheric CHartographY" (SCIAMACHY). Being originally developed for atmospheric applications, hyperspectral sensors like SCIAMACHY do not provide operational water-leaving radiance products as do ocean color sensors. Since the pixel size of these data is very large (30 km by 60 km per pixel) and global coverage by these measurements is reached only within six days which limits the application of hyperspectral-based PFT data products.
To overcome the short-comings of current multi-and hyper-spectral PFT products the synergistic retrieval of PFT from space from hyper- and multispectral measurements (SynSenPFT) was developed to improve the retrieval of PFTs from space by exploring the synergistic use of low-spatial-hyper-spectral and high-spatial-multi-spectral satellite data. The SynSenPFT algorithm is based on input data of the improved/revised existing PFT algorithms based on hyper- (PhytoDOAS) and multi-spectral (OC-PFT) and then by combining those synergistically to derive PFT products with temporal and spatial resolution as multispectral ocean colour data but using the spectral information from the hyperspectral data. The algorithm principles, sensitivity studies and its thorough validation against a large global in-situ phytoplankton group data set have been published now (Losa et al 2017). This synergistic algorithm can be later applied to produce a synergistic PFT product from hyperspectral sensors Sentinel-5-Precursor, Sentinel-4 and Sentinel-5 and multispectral sensor OLCI on Sentinel-3 to ensure the prolongation of the time series over the next decades.
Further information can be found under:
Losa S., Soppa M. A., Dinter T., Wolanin A., Brewin R. J. W., Bricaud A., Oelker J., Peeken I., Gentili B., Rozanov. V. V., Bracher A., Synergistic exploitation of hyper- and multispectral precursor Sentinel measurements to determine Phytoplankton Functional Types at best spatial and temporal resolution (SynSenPFT). Frontiers in Marine Science Front. Mar. Sci. 4: 203; doi: 10.3389/fmars.2017.00203;
SynSenPFT-webpage:
https://www.awi.de/en/science/climate-sciences/physical-oceanography/main-research-focus/ocean-optics/projects/synsenpft.html
July 2017:
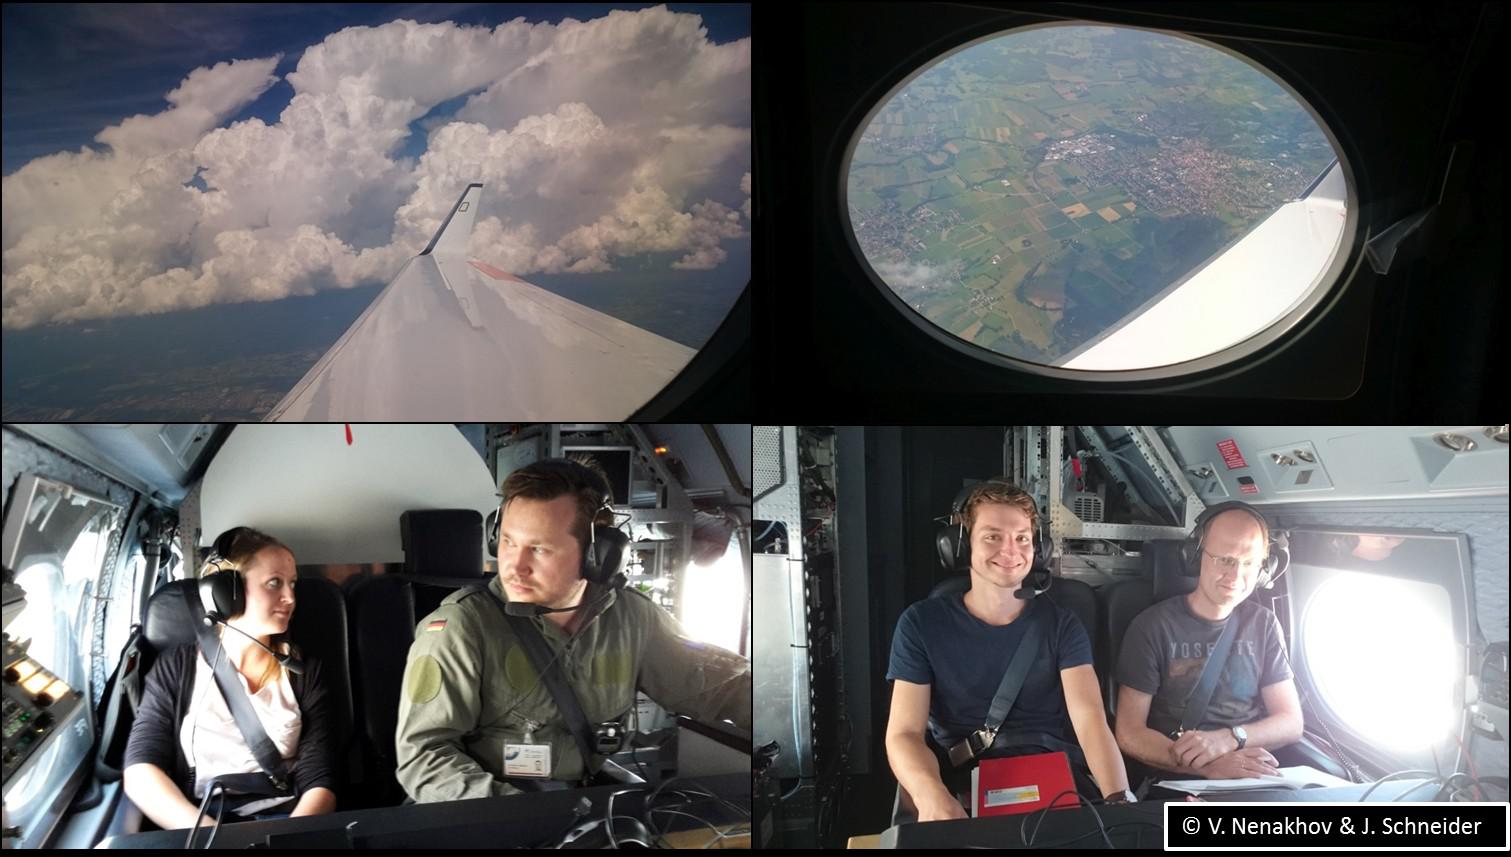
Led by IUP-UB and in collaboration with eight German universities and research centers, the DFG project Effect of Megacities on the transport and transformation of pollutants on the Regional to Global scales, EMeRGe, aims to investigate the regional and global impact of pollutants emitted from European and Asian major population centers (MPC).
The first intensive EMeRGe airborne measurement campaign using the airborne platform HALO (High Altitude and Long Range Research Aircraft) will be carried out from the 10thto the 31st of July 2017 over Europe. After the installation and preparation phases with basis at DLR in Oberpfaffenhofen, a total of 52 HALO flight hours has been allocated for this part of the investigation with particular focus on European target MPC (London, Benelux, Ruhr area, Rome, Po Valley), the Mediterranean and Central Europe within summer events of photochemical interest.
Complementary measurements over Europe from the airborne platforms FAAM (www.faam.ac.uk) and ERA CNR SkyArrow, and from the European lidar and ground base network will be additionally carried out and used for planning and analysis in the framework of the EMeRGe international research partnership.
Further details can be found at www.iup.uni-bremen.de/emerge/
June 2017:
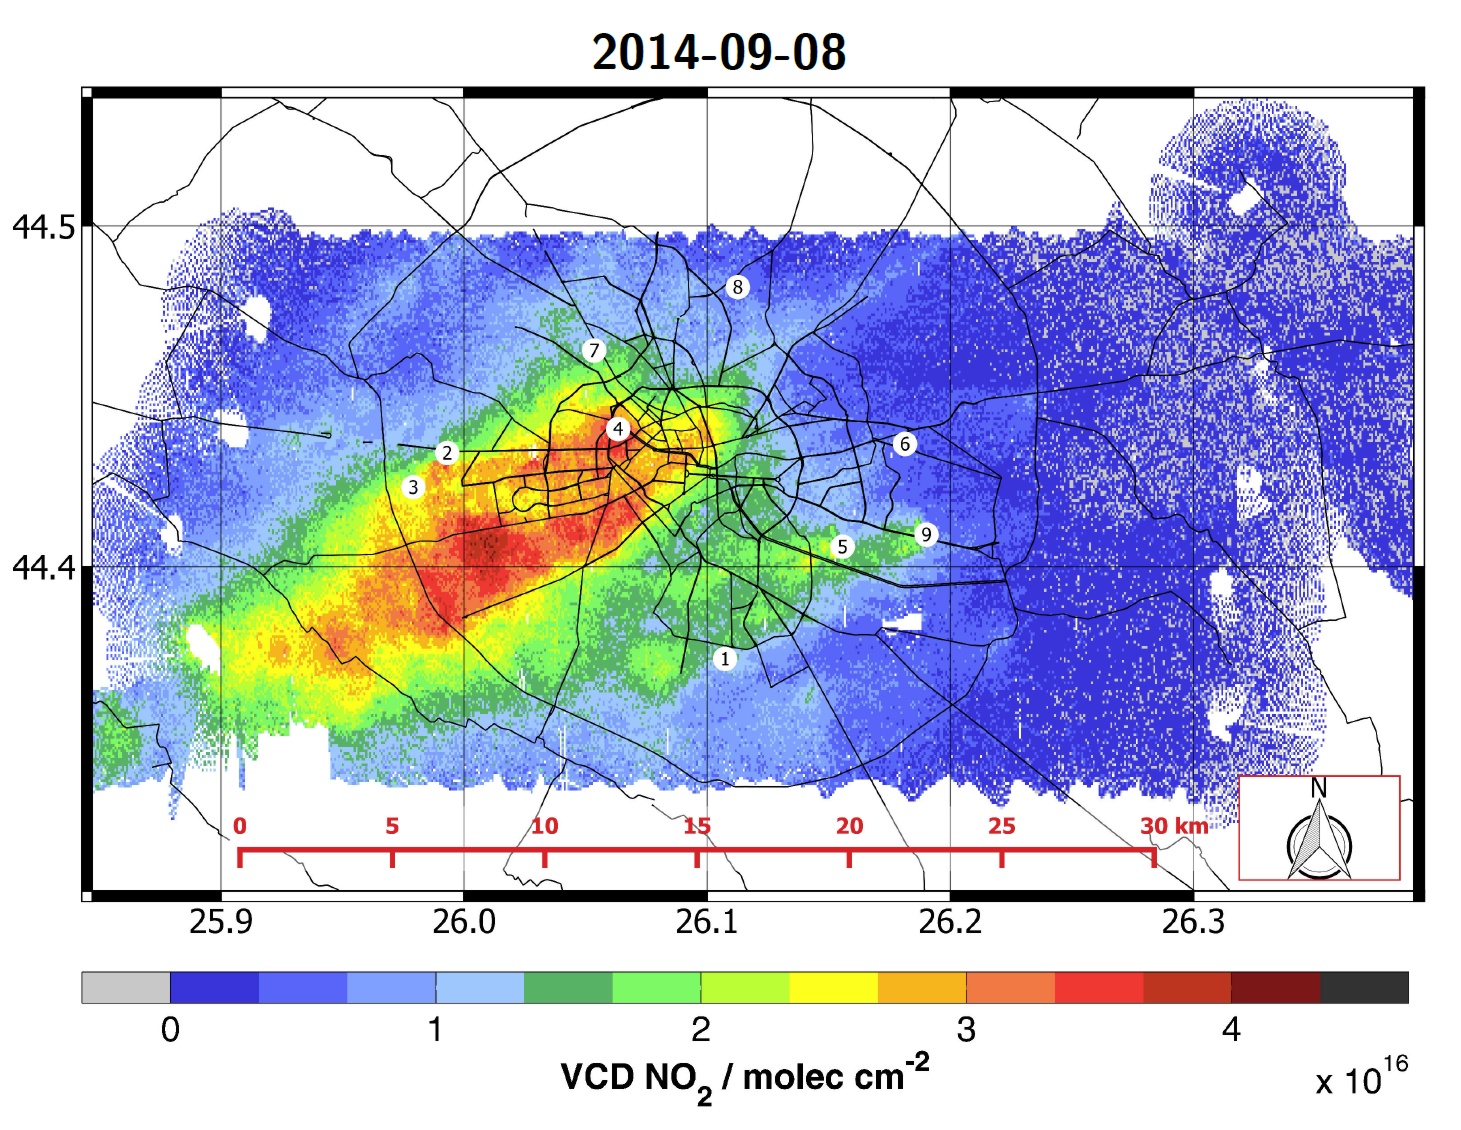
Vertical Colum Densities of NO2 measured above Bucharest on Monday 2014-09-08
Global maps of nitrogen dioxide (NO2) pollution are nowadays routinely produced from data of satellites such as GOME, SCIAMACHY, OMI and GOME-2. A similar instrument installed on an aircraft results in the same type of maps of tropospheric NO2columns, but with a much higher spatial resolution. During the AROMAT (Airborne Romanian Measurements of Aerosols and Trace gases) campaign which took place in Romania in summer 2014, the AirMAP instrument was installed on board of a Cessna operated by the FU Berlin and took such measurements above Bucharest on several days with a spatial resolution of the order of 100m. The image shows an example of the resulting maps , demonstrating the degree of spatial variability found in an area comparable to just a single pixel of a current state of the art satellite instrument. Comparison between measurements taken at different times and on different days also illustrates large temporal variations, underlying the need for geostationary satellites which can provide several measurements per day for the same location.
The AirMAP instrument is an imaging DOAS spectrometer covering either a band in the visible for high sensitivity NO2retrievals, or a spectral range more in the UV enabling simultaneous detection of SO2and NO2, albeit at lower signal to noise ratio. Data analysis employs the Differential Optical Absorption Spectroscopy (DOAS) method and air mass factors (AMF) based on surface reflectance values derived from the measurements of the AirMAP instrument. Validation of the AirMAP NO2columns with MAX-DOAS measurements from cars operated at the same time during the campaign by the Max-Planck Institute for Chemistry in Mainz and the University of Galati, Romania showed very good agreement, in particular for those measurements for which the time difference was small.
High resolution maps of tropospheric NO2can be used for a variety of applications, including satellite validation, analysis of the representativeness of low spatial resolution observations, emission estimates, and pollution mapping. The AirMAP instrument has already been operated during several other campaigns and it is planned to also employ it for validation of the upcoming Sentinel-5 precursor satellite.
More details can be found in:
Meier, A. C., Schönhardt, A., Bösch, T., Richter, A., Seyler, A., Ruhtz, T., Constantin, D.-E., Shaiganfar, R., Wagner, T., Merlaud, A., Van Roozendael, M., Belegante, L., Nicolae, D., Georgescu, L., and Burrows, J. P.: High-resolution airborne imaging DOAS measurements of NO2 above Bucharest during AROMAT, Atmos. Meas. Tech., 10, 1831-1857, doi:10.5194/amt-10-1831-2017, 2017.
May 2017:
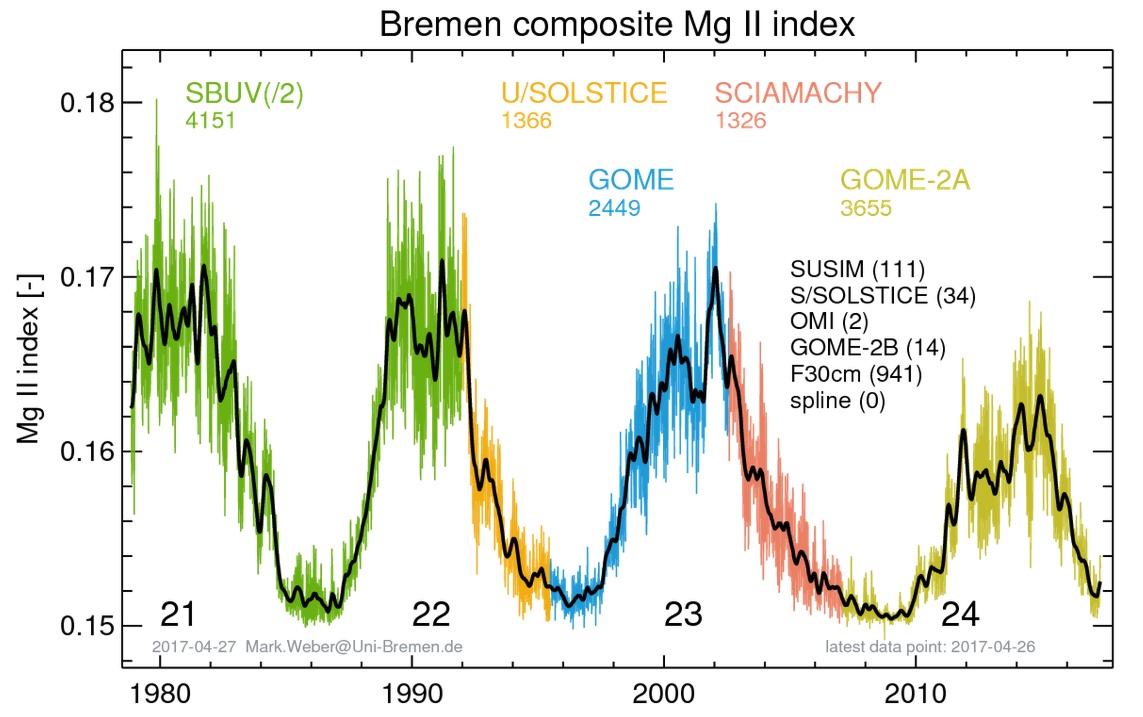
Bremen composite Mg II index
Der Mg II Index ist ein Proxy für die Variabilität der solaren UV Strahlung, die mit der Sonnenaktivität variiert. Neben dem 11-Jahre Zyklus (Schwabe-Zyklus) verändert sich die solare UV Strahlung auch mit der Rotationsperiode der Sonne, die im Mittel etwa 27 Tage beträgt (Carrington-Zyklus). Der Mg II Index korreliert mit der Anzahl der Sonnenflecken, die vom solaren Minimum zum Maximum eines 12-Jahreszyklus zunimmt. Zur Zeit nähern wir uns dem solaren Minimum des nächsten Sonnenzyklus (Zyklus 25). Der Schwabe-Zyklus unterliegt Schwankungen in der Länge (10-12 Jahre) und der Intensität. Das Aktivitätsmaximum des Schwabe-Zyklus 24 (2014/15) war niedriger als die der drei vorherigen Zyklen 21 bis 23.
Der Mg II index wird bei uns aus den täglichen Sonnenmessungen der Satelliteninstrumente GOME, SCIAMACHY, GOME-2A, und -2B seit 1995 abgeleitet. Zusammen mit anderen Satellitendaten kann ein kombinierter Datensatz (´´Composite Mg II Index´´) erstellt werden, der etwa 38 Jahre umfasst (1978-2017) und sich über die Sonnenzyklen 21 bis 24 erstreckt. Diese Zeitserie wird täglich aktualisiert und aktuelle Daten und Bilder sind abrufbar unter http://www.iup.uni- bremen.de/UVSAT/Datasets/mgii.
Die UV Strahlung und deren Variation (Sonnenaktivität) hat einen starken Einfluss auf das stratosphärische Ozon und bestimmt die thermische Struktur der oberen Stratosphäre und beeinflusst damit die globale Luftzirkulation in der oberen Atmosphäre (oberhalb von 20 km).
April 2017:
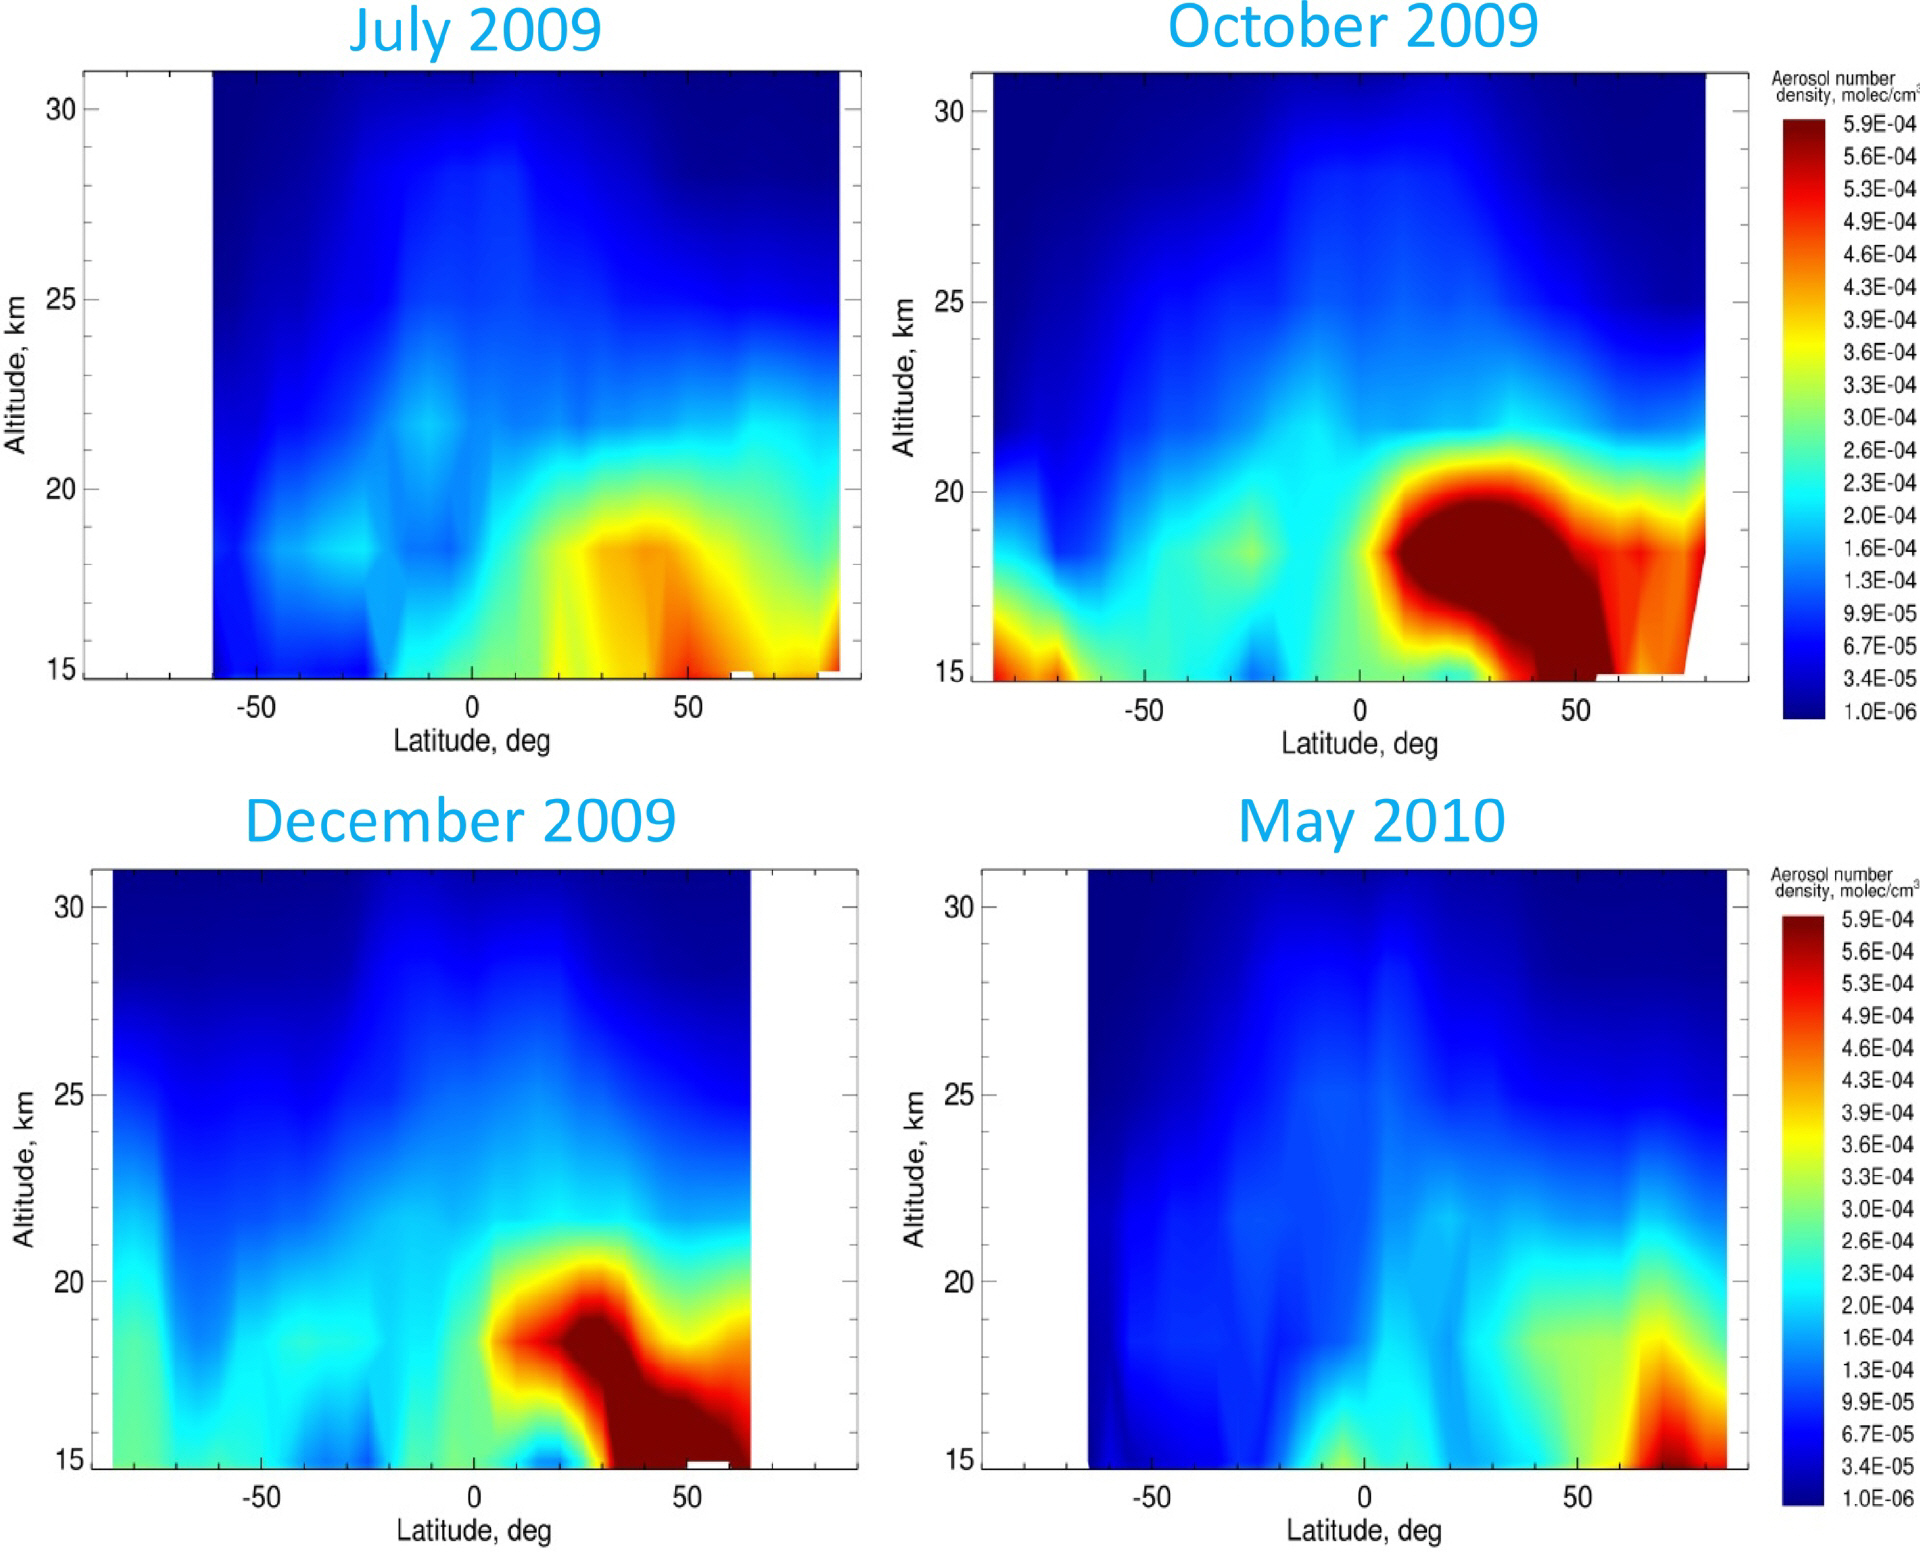
Evolution of the volcanic plume after the Sarychev Peak eruption
Plots show zonal monthly mean aerosol extinction coefficients at 750 nm retrieved from SCIAMACHY limb measurements at the University of Bremen (V1.4). The volcanic plume is found to reach about 21 km altitude.
July 2009: the month just after the eruption of the Sarychev Peak (48oN, 153oE; June 11-21, 2009). A moderate increase of the stratospheric aerosols is seen around 50oN latitude.
October 2009: aerosol extinction is strongly increased, the plume is transported mostly equatorward.
December 2009: the aerosol load begins to decrease, tropical region is close to the background state.
May 2010: about 1 year after the eruption, the aerosol loading returns to its background state southwards from 50oN
March 2017:
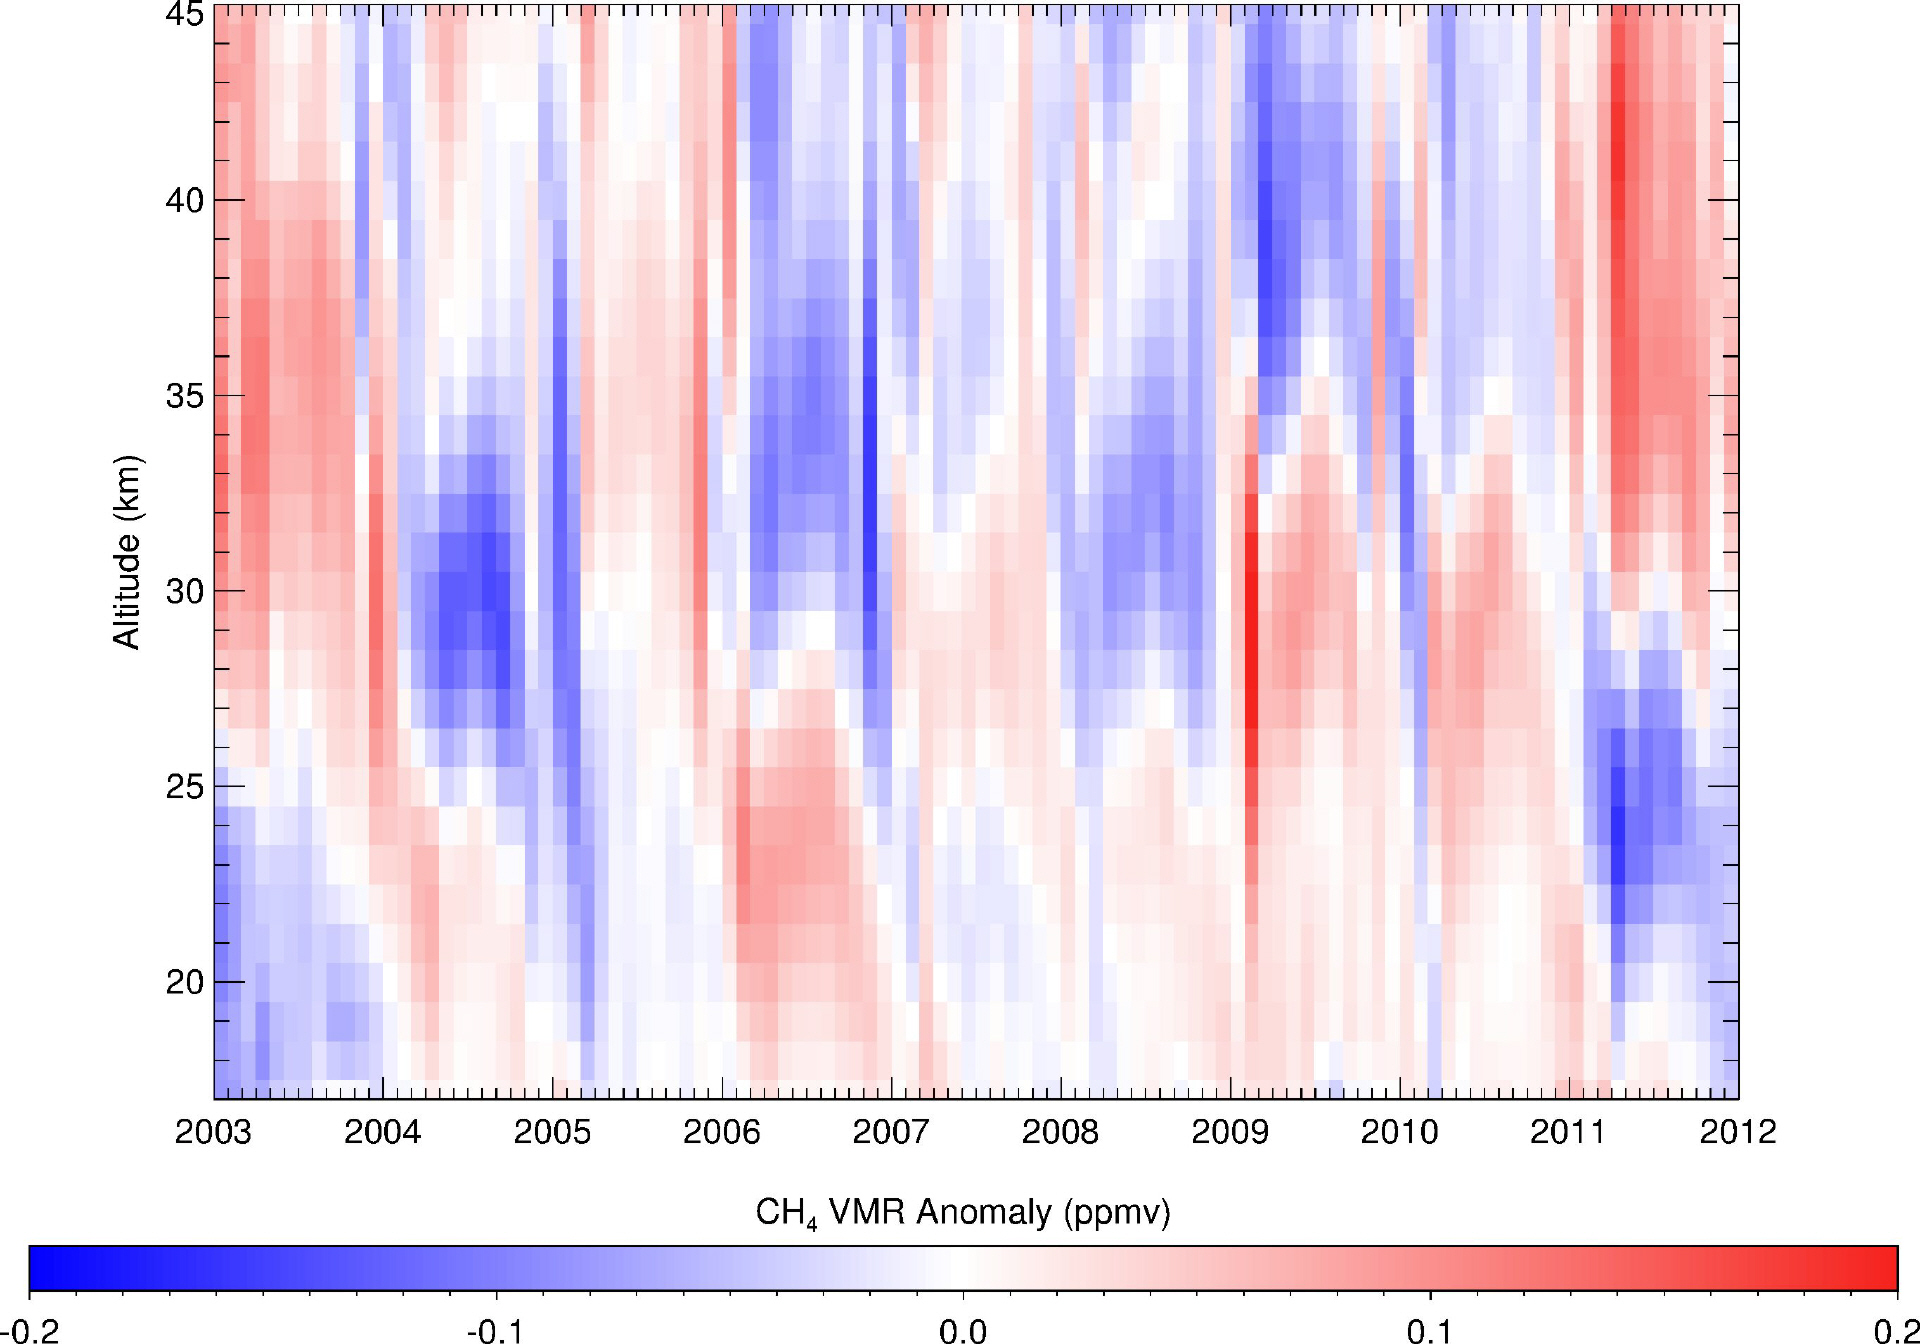
Changes of stratospheric methane 2003 – 2011
Next to carbon dioxide (CO2), methane (CH4) is the most important anthropogenic greenhouse gas. It is produced in the lower atmosphere (the troposphere). Because of its long lifetime, it is eventually transported into higher altitudes, the stratosphere.
The figure (from Noël et al., 2016) shows the changes of stratospheric methane between 2003 and 2011 at Northern mid-latitudes derived from solar occultation measurements of the SCIAMACHY instrument on the ENVISAT satellite. The data have been averaged over one month, and seasonal variations have been removed, resulting in the displayed ‘anomalies’. This way, non-regular and long-term variations in the data become more visible.
In the current case, no clear methane trend for the period 2003 to 2011 can be identified, but there is a prominent variation between positive (red) and negative methane (blue) anomalies. This feature can be explained by transport effects related to the so-called quasi-biennial oscillation (QBO). The QBO is a change of stratospheric winds from easterly to westerly (and vice-versa) which occurs approximately every two years.
Reference:
Noël, S., K. Bramstedt, M. Hilker, P. Liebing, J. Plieninger, M. Reuter, A. Rozanov, C. E. Sioris, H. Bovensmann and J. P. Burrows, Stratospheric CH4 and CO2 profiles derived from SCIAMACHY solar occultation measurements, Atmos. Meas. Tech., 9(4), 1485-1503, 2016, doi: 10.5194/amt-9-1485-2016, http://www.atmos-meas-tech.net/9/1485/2016/
February 2017:
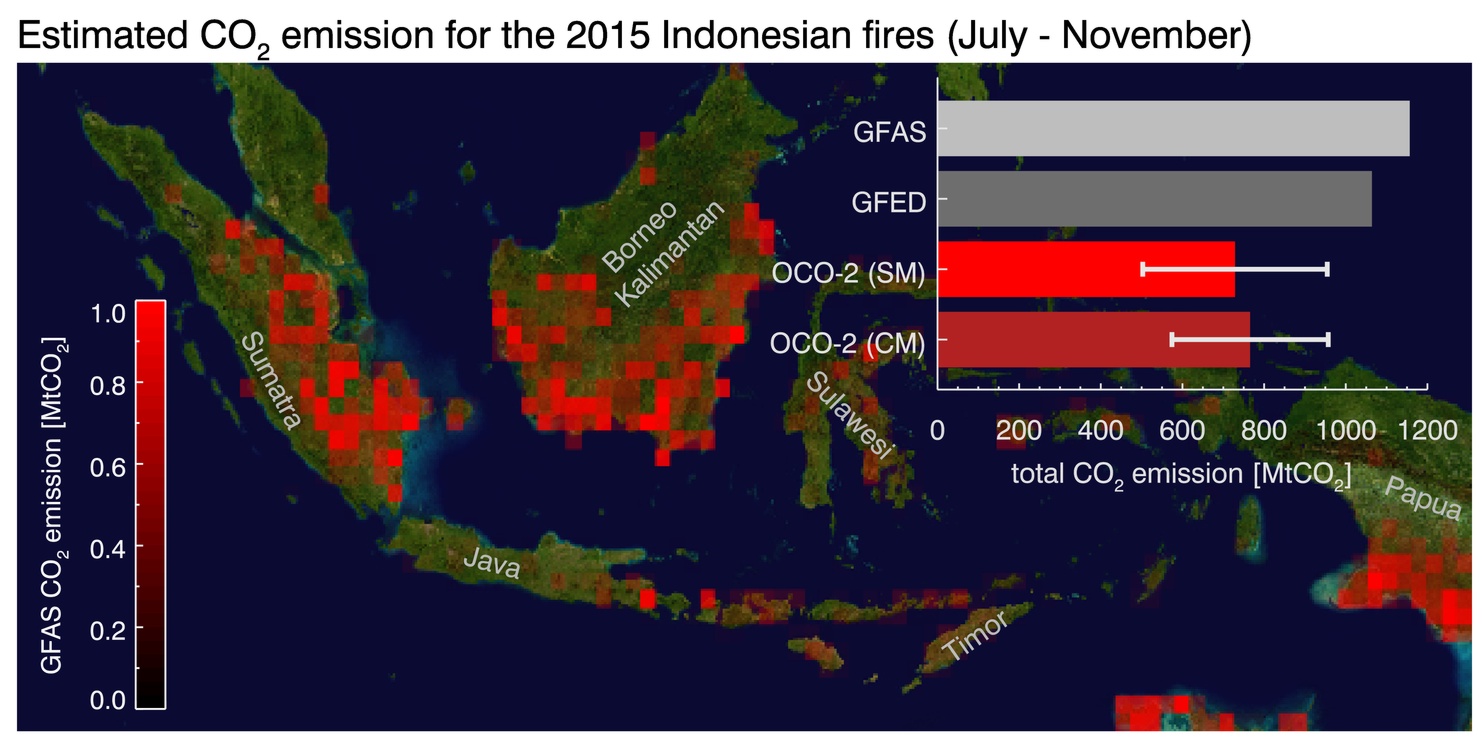
Indonesia experienced an exceptional number of fires in 2015 as a result of droughts related to an El Niño event. This situation was further intensified by human activities such as clearing of rain forests and drainage of peat land. These fires released large amounts of the greenhouse gas carbon dioxide (CO2) into the atmosphere. Emission databases such as the Global Fire Assimilation System (GFASv1.2) and the Global Fire Emission Database (GFEDv4s) estimated the CO2 emission to be approximately 1100 Mt CO2 in the time period from July to November 2015, which is more than the yearly anthropogenic CO2 emission of an industrialised country such as Germany. The emission from the database was indirectly estimated by using parameters like burned area, fire radiative power, and emission factors but not directly from CO2measurements.
In a recent study, the Indonesian fire CO2 emission is estimated by using CO2 concentrations derived from measurements of the Orbiting Carbon Observatory-2 (OCO-2) satellite mission. The estimated CO2 emissions for the Indonesian fires in the time period from July to November 2015 are shown in the figure above (bars to the right) based on OCO-2 (red, dark red columns are the satellite based CO2 emissions obtained by using two different methods) compared to the GFASv1.2 (light grey) and GFED4s emissions (dark grey). Shown is also the spatial distribution of the fire CO2 emissions based on GFASv1.2. The mean emission based on the satellite CO2 data is 748±296 MtCO2, which is about 30% lower than provided by the emission databases. More details about this study can be found in the publication of Heymann et al., 2017 (http://onlinelibrary.wiley.com/doi/10.1002/2016GL072042/full).
January 2017
IUP-UB participation in the CINDI-2 campaign
In September 2016, the Second Cabauw Intercomparison of Nitrogen measuring Instruments (CINDI-2) took place in Cabauw, the Netherlands. This campaign brought together more than 30 groups from all over the world to compare instruments and analysis methods for quantifying tropospheric and stratospheric NO2amounts. Most of the groups performed different versions of Differential Optical Absorption Spectroscopy (DOAS) measurements using sun light scattered in the atmosphere. The measurements had to follow a strict prescribed protocol and results from a day of measurements were submitted the next morning to a referee who collected them in a semi-blind comparison. The results were presented and discussed during daily meetings but curves were not labelled to keep the comparison semi-blind. A detailed analysis is currently being prepared and will be finalised during a dedicated workshop in April 2017.
During the CINDI-2 campaign, IUP-UB deployed not only a standard 2d-MAX-DOAS instrument and a mobile DOAS instrument mounted on the IUP Messwagen, but for the first time also operated the new Imaging DOAS instrument called IMPACT. This instrument which is a collaboration between the LAMOS and DOAS groups at IUP-UB takes a full vertical scan instantaneously, and scans the azimuthal direction over time. This greatly reduces the time needed for a full hemispherical scan of the atmospheric radiation field to less than 15 minutes. From these measurements, both the horizontal and the vertical gradients of NO2can be retrieved at high temporal resolution. The results could be compared to the retrievals from the 2d-MAX-DOAS instrument and good agreement was found. The instrument will be used for the analysis of pollution plumes and localised emission sources.
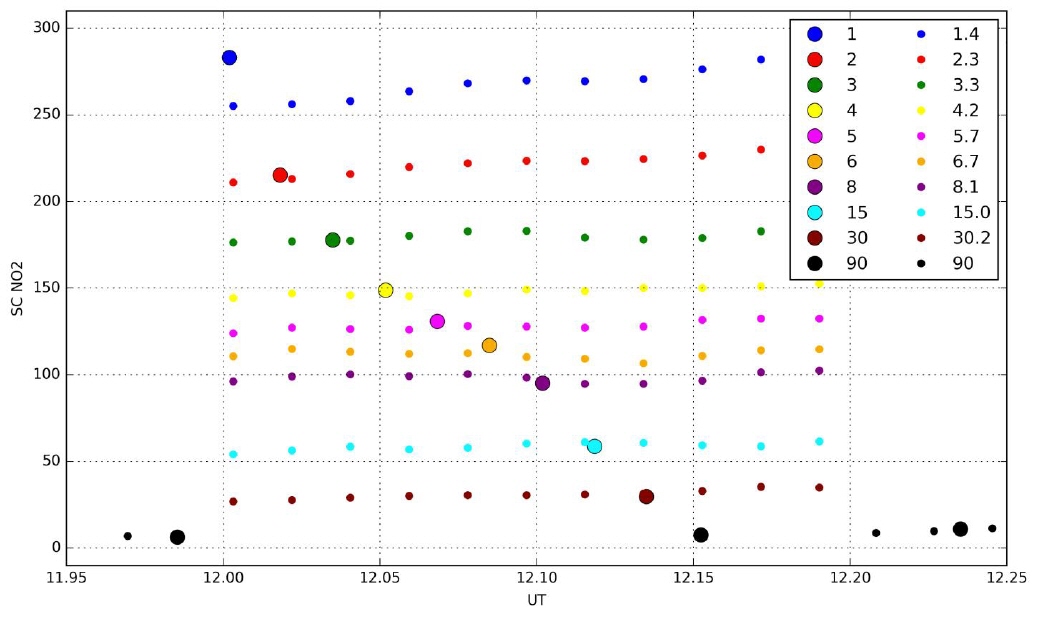
Figure: First Comparison of NO2 slant columns derived from the IUP-UB 2d MAX-DOAS instrument (large points) and the IMPACT imaging DOAS instrument. Very good agreement is found with the exception of the lowest viewing angle which is sensitive to the larger field of view of the imaging instrument. The much better temporal resolution of the imaging instrument is apparent which took 11 individual scans during one single scan of the MAX-DOAS instrument. As can be seen from the temporal evolution of the imaging data, the NO2distribution was not constant over the measurements, highlighting the advantage of rapid measurements.
August 2016
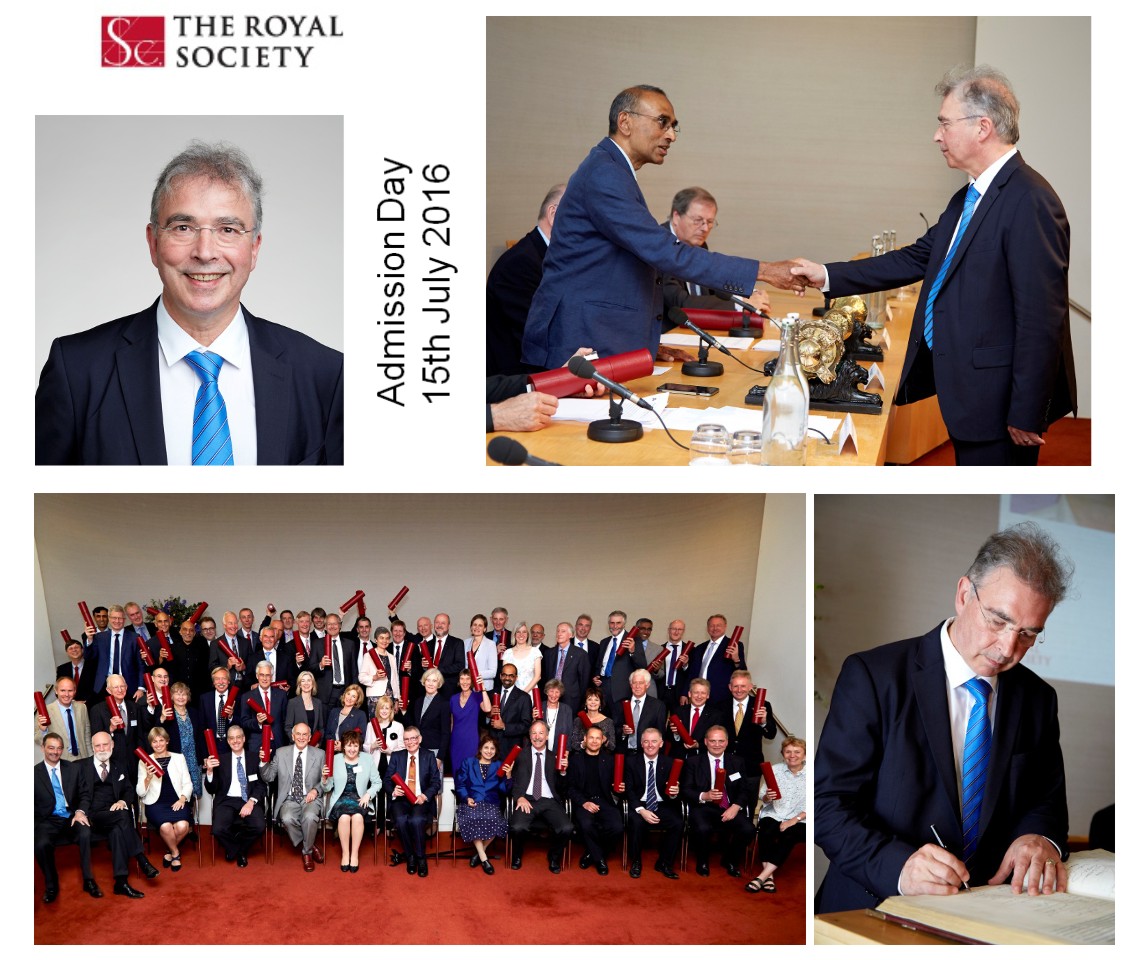
On 15th July 2016, Prof. John P. Burrows was admitted into the
Royal Society together with 59 other new fellows and foreign members in
a formal ceremony known as „Admission Day“. The ceremony is preceded
by a 2-day seminar where the new fellows give a talk about their current
research. The image shows a collage of pictures taken during Admission Day.
Prof. Dr. John P. Burrows FRS
With Venki Ramakrishnan, President of the Royal Society
The new fellows and foreign members for 2016/
Prof. Burrows 5th from the right, top row
4) Prof . Burrows signing the Charter Book.