

Image of the Month
April 2026:

Many sea ice models rely on very simple representations of sea ice albedo and use it as a tuning parameter, trading accuracy or more complex physics for simplicity and lower computational cost. Here, we present a novel data-driven framework to discover an analytical formulation for sea ice albedo (Atmojo et al., 2025) using PySR, a Python package for symbolic regression (Cranmer et al., 2020), with the aim to improve existing sea ice albedo parametrisations. To train our Machine Learning models, we use satellite observations and reanalysis products, which provide daily, multiyear pan-Arctic data on a spatial resolution of 25km. The core of our methodology, shown in the top figure, is parsimony (Beucler et al., 2025), developing a model which reproduces observed sea ice albedo well enough with the lowest complexity as possible and therefore, strengthen simplicity and interpretability.
The bottom figure demonstrates that the equation proposed in our study captures the observed seasonal cycle well compared to the Parkinson and Washington (1979) parametrisation (PW79). In September, the reference observation, VIIRS, shows a decrease of sea ice albedo, which contradicts expected freeze-up behaviour of Arctic Sea ice due to increasing solar zenith angle that decreases the quality and accuracy of the VIIRS albedo product. Likely due to the sparse observational data available for September as a result of reduced sunlight, PySR relies more heavily on the complete data from previous spring and summer months. Consequently, our proposed equation effectively corrects for potential measurement artefacts in the September data by leveraging functional relationships learnt from better sampled months.
References
Atmojo, D. W., Weigel, K., Grundner, A., Holland, M. M., Sidorenko, D., and Eyring, V.: Data-driven equation discovery of a sea ice albedo parametrisation, EGUsphere [preprint], https://doi.org/10.5194/egusphere-2025-3556, 2025.
Beucler, T., Grundner, A., Shamekh, S., Ukkonen, P., Chantry, M., Lagerquist, R.: Distilling Machine Learning’s Added Value: Pareto Fronts in Atmospheric Applications, Artificial Intelligence for the Earth Systems, https://doi.org/10.1175/AIES-D-24-0078.1, 2025.
Cranmer, M., Sanchez-Gonzalez, A., Battaglia, P., Xu, R., Cranmer, K., Spergel, D., and Ho, S.: Discovering Symbolic Models from Deep Learning with Inductive Biases, https://doi.org/10.48550/ARXIV.2006.11287, publisher: arXiv Version Number: 2, 2020.
March 2026:

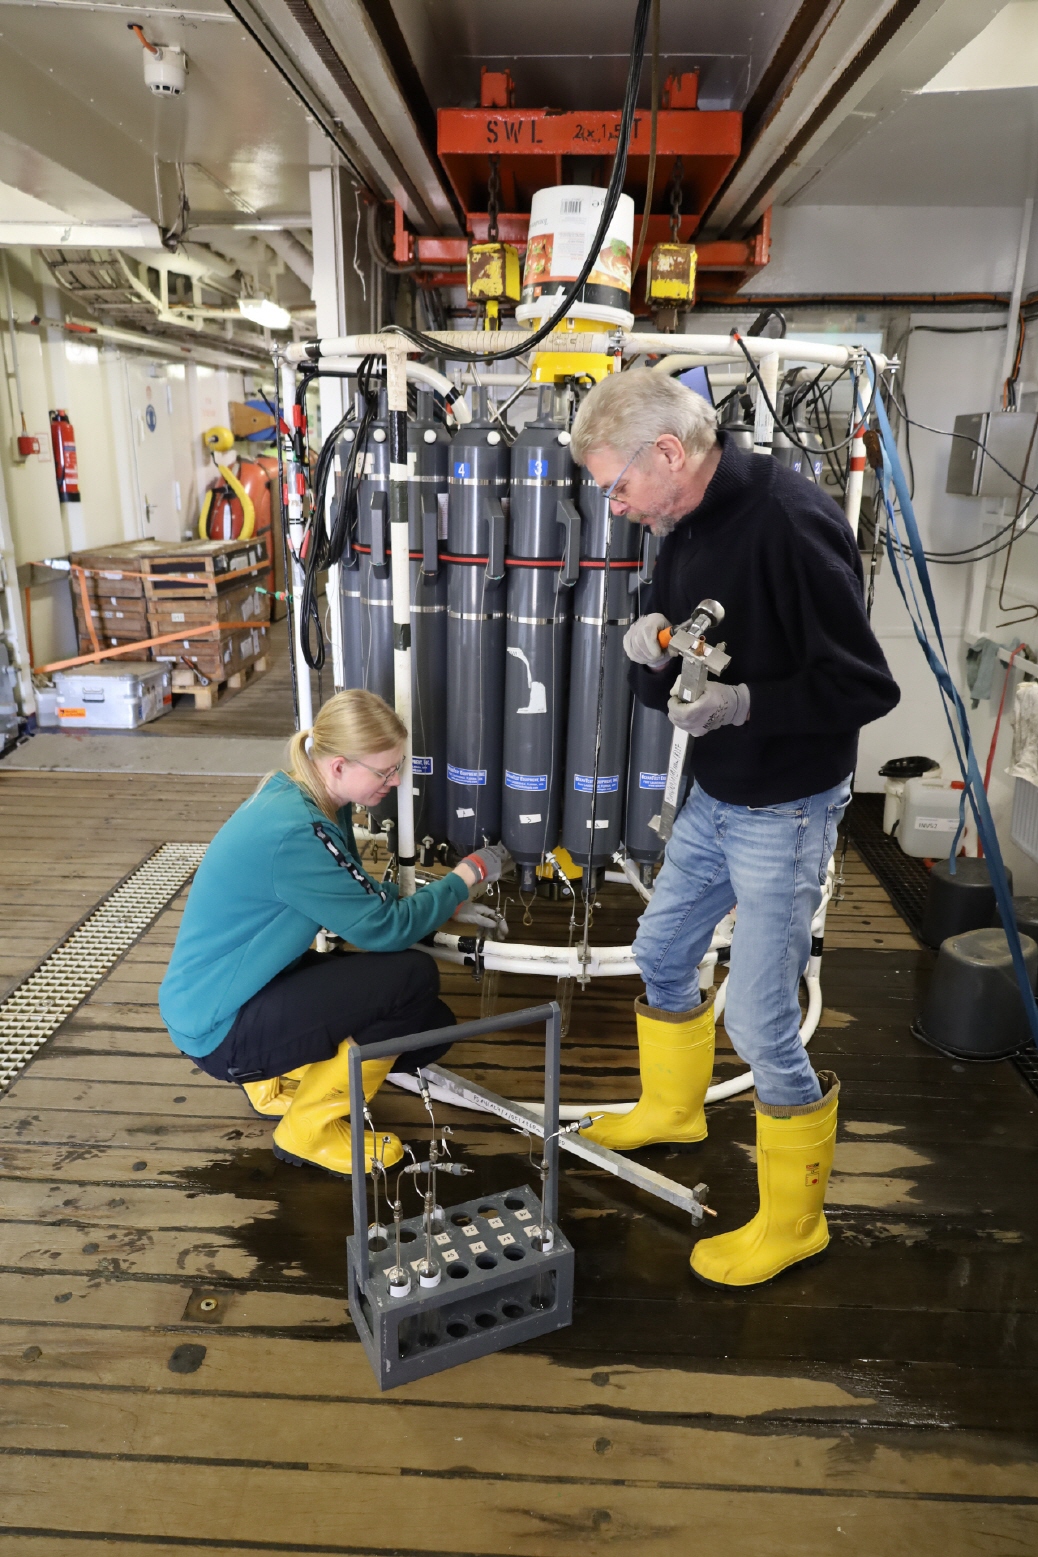
IUP Oceanography colleagues Oliver Huhn, Jolanda Grimm, and Andreas Rogge are currently on board the research icebreaker Polarstern to participate in the Summer Weddell Outflow Study (SWOS) . By collecting water samples and underwater sensor data, they investigate the role of water mass transformation and circulation for the carbon budget of the western Weddell Sea.
February 2026:

Upper left: Correlation between an effective (anti)cyclone strength from ERA5 data and an effective ozone change strength derived from total ozone column measurements from Sentinel-5P. All cyclones (blue) and anticyclones (red) with complete S5P coverage between 2019 and 2022 are included.
Upper right: Example of a collocation illustrating the method used to derive the effective cyclone and ozone change strength. Shown are an upper-level cyclone defined by the 250 hPa geopotential height anomaly (lower surface) from ERA5 data and the collocated total ozone column measured by S5P (upper surface). The effective strength of both the cyclone and the associated ozone change is quantified by the volume enclosed between the observed surface and a reference surface defined by the mean value at the system border. This volume represents the net increase of ozone and the net decrease of pressure within the cyclone relative to its surroundings.
Lower left: The 250 hPa geopotential height from ERA5 data corresponding to the lower surface in the plot shown above. The cyclone border is marked in red, and the Sentinel-5P footprint for the corresponding overpass is shown in purple.
Lower right: Total ozone column measured by Sentinel-5P for the same overpass and cyclone, corresponding to the upper surface in the plot shown above.
Cyclones and anticyclones are associated with systematic variations in the total ozone column, a relationship already identified in the early 20th century. Here, we demonstrate for the first time that satellite-based total ozone column measurements can be used to quantitatively assess the strength of synoptic events. To achieve this, we introduce methods to calculate the effective strength of the (anti)cyclones from ERA5 data und the ozone change derived from Sentinel-5P measurements, optimised for nadir observations, considering the high horizontal resolution and accounting for the ozone anomaly of all pixels within the (anti)cyclone area. Applying this approach to all fully covered cyclones and anticyclones between 2019 and 2022 reveals a strong correlation between the strength of synoptic events and the strength of the induced ozone change.
This relationship indicates that nadir total ozone column measurements contain dynamically relevant information on the strength of synoptic-scale systems and highlights the potential of satellite ozone observations as a valuable input for data assimilation and for improving the representation and strength assessment of cyclones and anticyclones in numerical weather prediction models.
January 2026:

Scientists at the Institute of Environmental Physics are specialised in the development, deployment and application of various types of sensors to locate and quantify emissions of anthropogenic greenhouse gases by measuring atmospheric Methane (CH4) and Carbon dioxide (CO2) distributions. To accurately estimate emissions from those distributions, precise data of the concentrations and the local wind fields are necessary. As many important emission sources emit greenhouse gases near the surface, it is important to collect the relevant data near to the surface. This can be achieved by a mobile lab. In 2025 the team succeeded to integrate a wind sensor, an in-situ trace gas analyser and an upward looking spectrometer for greenhouse gas column concentration measurements into IUP's mobile lab truck.
First test cruises were performed in Northwest Germany, in regions where sources of biogenic (agriculture) and geogenic (for example gas facilities) Methane are nearby. An example is given in Figure above. The collocated measurements of Methane and Ethane allows the clear discrimination of biogenic and geogenic Methane, as only the latter co-emits Ethan. The mobile lab measurements of greenhouse gas concentrations and wind fields are complementing a similar sensor set-up on a motor-glider (Image of the month June 2022). Combined airborne and mobile lab data will be collected to investigate how the combined data set will help to improve independent emission quantification. Students interested to work with us are always welcomed, especially in case they have a driving licence for trucks (C1/C).
Contact:
Heinrich Bovensmann heinrich.bovensmann@uni-bremen.de
Jakob Thoböll jthoboell@iup.physik.uni-bremen.de
December 2025:

Upper: Schematic illustration of the effects of meteorological and emission changes on the three-year variations in PM2.5
pollution in the Pearl River Delta
Lower: Contributions of local emissions (Emis_L), outer emissions (Emis_O) and meteorology (Meteo) to changes in PM2.5
concentrations (noted in bold; increases noted in red, and decreases noted in blue) and regional source contributions in the Pearl River Delta during the cold seasons of 2015–2017, derived from the WRF-CMAQ simulations (see Qu et al., 2025 for details)
Persistent PM2.5 pollution in the Pearl River Delta (2015–2017): Meteorology vs. Emission reductions
Fine particulate matter (PM2.5) poses a serious threat to human health, and thus efforts are needed to mitigate regional PM2.5pollution. In China, one of the countries most affected by severe PM2.5 pollution, emission control measures have often been effective in reducing PM2.5 levels. However, the role of meteorology in driving multi-year variations in PM2.5 pollution cannot be overlooked. In this study, we investigated PM2.5 changes in the Pearl River Delta region, South China, during the cold seasons of 2015-2017, a period when PM2.5 pollution persisted despite rapid emission reductions.
We found that the persistent PM2.5 pollution during these three cold seasons was closely linked to changes in meteorological conditions, associated with the transition from El Niño in 2015 to La Niña in 2017. This transition led to stronger northerly winds, enhancing cross-regional transport of PM2.5 and its precursors from more polluted regions in North and Central China, while simultaneously weakening local PM2.5 production and accumulation. Simulations using the WRF/CMAQ model further indicate that PM2.5 concentrations decreased in the first two cold seasons and increased again thereafter, but the contribution from regional transport to PM2.5 increased consistently, rising from 70% in 2015 to 74% in 2016 and 78% in 2017. Relative results have been published in Atmospheric Chemistry and Physics (Qu et al., 2025).
Acknowledgement:
This work is supported by the National Key Research and Development Program of China, the Deutsche Forschungsgemeinschaft (DFG, German Research Foundation) under Germany´s Excellence Strategy and co-funded DFG-NSFC Sino-German Air-Changes project.
Reference:
Qu, K., Wang, X., Yan, Y., Jin, X., He, L.-Y., Huang, X.-F., Cai, X., Shen, J., Peng, Z., Xiao, T., Vrekoussis, M., Kanakidou, M., Brasseur, G. P., Daskalakis, N., Zeng, L., and Zhang, Y.: Unexpectedly persistent PM2.5 pollution in the Pearl River Delta, South China, in the 2015–2017 cold seasons: the dominant role of meteorological changes during the El Niño-to-La Niña transition over emission reduction, Atmos. Chem. Phys., 25, 16983–17007, https://doi.org/10.5194/acp-25-16983-2025, 2025.
Contact:
Kun Qu (qukun@uni-bremen.de)
November 2025:
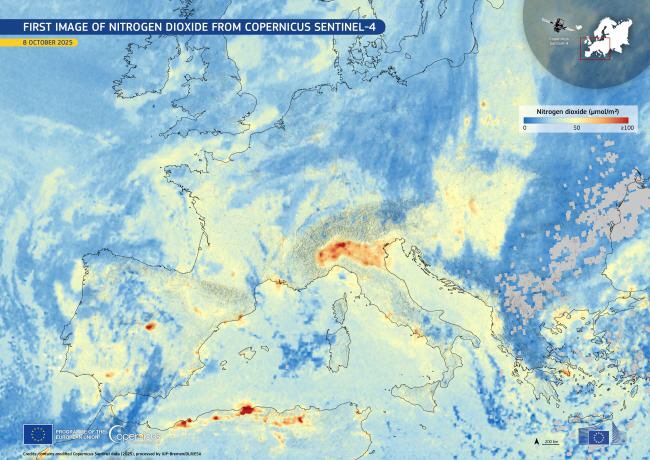
On October 8, the European Sentinel-4 instrument performed its first atmospheric measurements. This instrument is in geostationary orbit and will provide hourly data for species such as ozone, NO2, formaldehyde, SO2, and glyoxal, as well as clouds and aerosols over Europe. The processors for NO2and glyoxal were developed at the Institute of Environmental Physics, University of Bremen, and the team is now busy evaluating the data and optimising the algorithms.
The Sentinel-4 instrument is the last in a constellation of three geostationary instruments observing atmospheric composition over Asia (GEMS), North America (TEMPO), and now Europe (Sentinel-4). It goes back to the first proposals for a geostationary instrument called GEOSCIA, put forward by Prof. John Burrows and colleagues more than 20 years ago.
Copernicus News: https://www.copernicus.eu/en/media/image-day-gallery/first-image-nitrogen-dioxide-copernicus-sentinel-4
ESA news: https://www.esa.int/Applications/Observing_the_Earth/Copernicus/Sentinel-4/Sentinel-4_offers_first_glimpses_of_air_pollutants
October 2025:
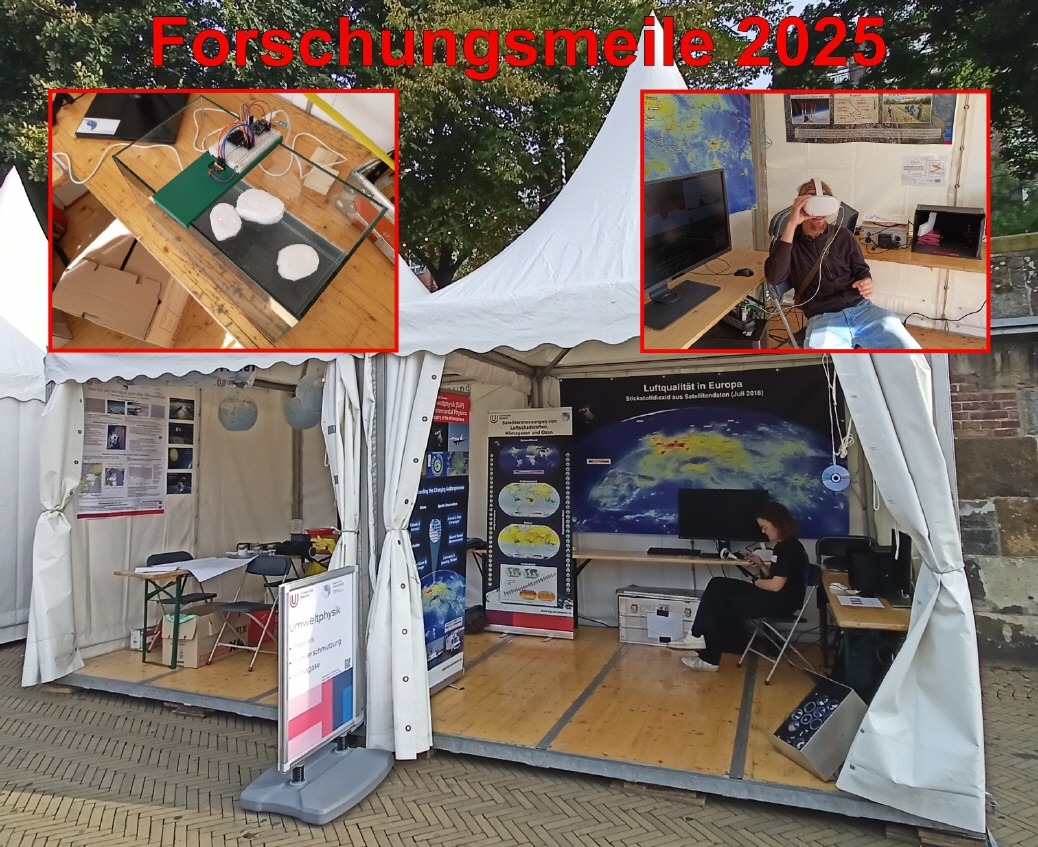
IUP at the Forschungsmeile 2025
This year, IUP again took part in the ‘Forschungsmeile’ during the ‘Maritime Woche’ on 20/21 September in Bremen. The remote sensing group and the physics and chemistry of the atmosphere group presented measurement techniques and research results from the areas of sea ice, air pollution and climate change to the public. Furthermore, visitors could take a virtual trip on a stratospheric balloon (see also ‘picture of the month’ from August 2025).
Contact: Stefan Noël (stefan.noel@iup.physik.uni-bremen.de)
September 2025:

Tracking CO₂ from Bremen’s Steel Factory
This image captures a measurement campaign at Bremen’s steel factory—one of the city’s largest CO₂ emitters—in spring 2025. To better understand how much CO₂ is released, the team from the IUP’s Department of Near-IR Remote Sensing and In Situ Measurements deployed a range of portable instruments around the site.
Gases such as CO₂, CO, and NO₂ were measured directly in the air near the factory using a combination of in-situ analysers, a DOAS instrument (red circle), and two EM27/SUN FTIR solar absorption spectrometers (orange circle and data).
To interpret the data, the team used Gaussian plume models to simulate how the emissions spread through the atmosphere under varying wind and weather conditions.
The aim of the project is to improve how we monitor emissions from large industrial sources—and to support more accurate, science-based climate reporting, starting right here in Bremen.
August 2025:
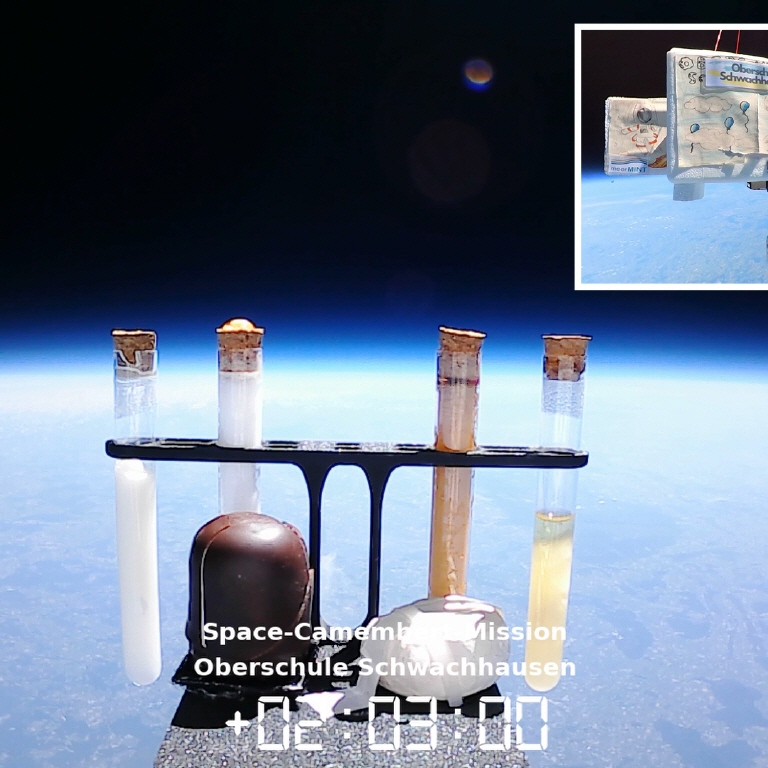
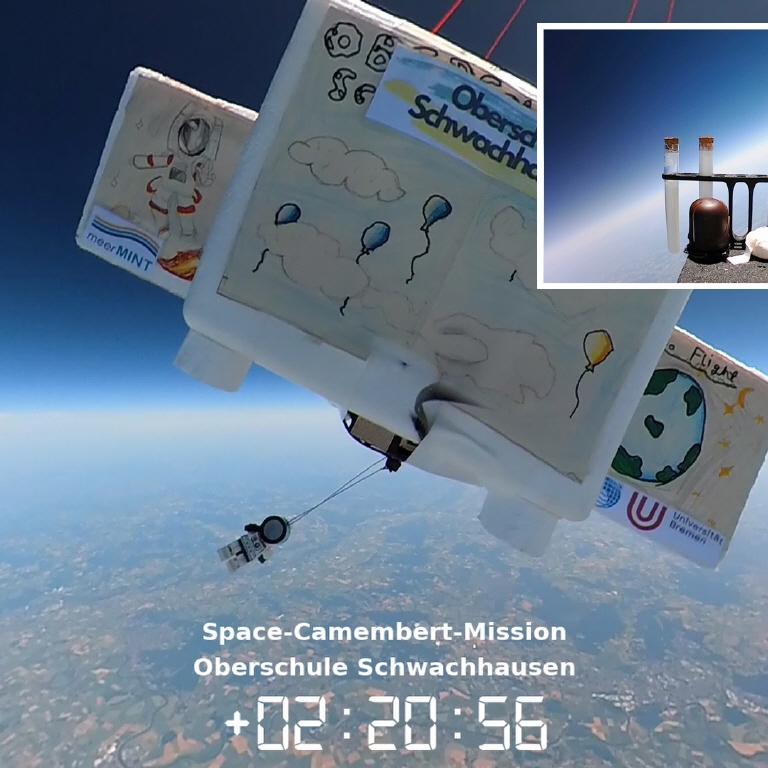

On 20.06.2025, the Space Camembert Mission of the newly founded Schwachhausen Secondary School took place. For this mission, a stratospheric probe was built together with the pupils of the Jugend forscht-Atelier. Using a weather balloon, it ascended to an altitude of nearly 40 km. During the flight, various meteorological parameters were measured, and several experiments were conducted.
At the highest point of its journey, the probe had left about 99.5% of Earth’s atmosphere beneath it. The footage captured by the onboard cameras vividly illustrates why many astronauts, upon returning from space, reported that Earth’s atmosphere seemed incredibly thin and fragile. The idea for the mission originated at the Institute of Environmental Physics of the University of Bremen, which, together with the meerMINT project, the Senator for Children and Education in Bremen, and the German Aerospace Center (DLR), substantially supported the mission.
Watch the highlights in a 9-minute video: https://youtu.be/o9FdLZvttq4
Watch the highlights in a 5-minute 360°-video: https://youtu.be/EIvRPPxC4kE
Watch the summary and interviews in a 4-minute video: https://youtu.be/9JP0iYdbI40
July 2025:

Time series and global maps of the atmospheric CO2 mixing ratio. As can be seen, atmospheric CO2 concentrations continue to rise unabated, despite global efforts to reduce CO2 emissions. The underlying data were produced by the IUP of the University of Bremen by combining measurements from several satellites and used by the Copernicus Climate Change Service (https://climate.copernicus.eu/) for a recent report (see European State of the Climate (ESOTC) 2024, https://climate.copernicus.eu/esotc/2024).
June 2025:

Studies on the changes in sunlight reflected from Greenland between 2007 and 2024
The underlying data was measured by a satellite instrument (GOME-2). This is a spectrometer that scans the Earth' surface and atmosphere and is able to measure the reflected sunlight at different wavelengths (corresponding to different colors in the visible spectrum of sunlight).
The image shows colored areas (blue to red) where the changes over the 17-year period are (statistically speaking) meaningful and reliable, while gray areas depict changes that are not pronounced enough to be certain. Importantly, blue areas, such as in the center of Greenland, show where reflected sunlight has decreased between 2007 and 2024, and red areas, such as the west coast of Greenland, show where it has increased instead. The team is currently investigating the possible causes of such changes.
May 2025:
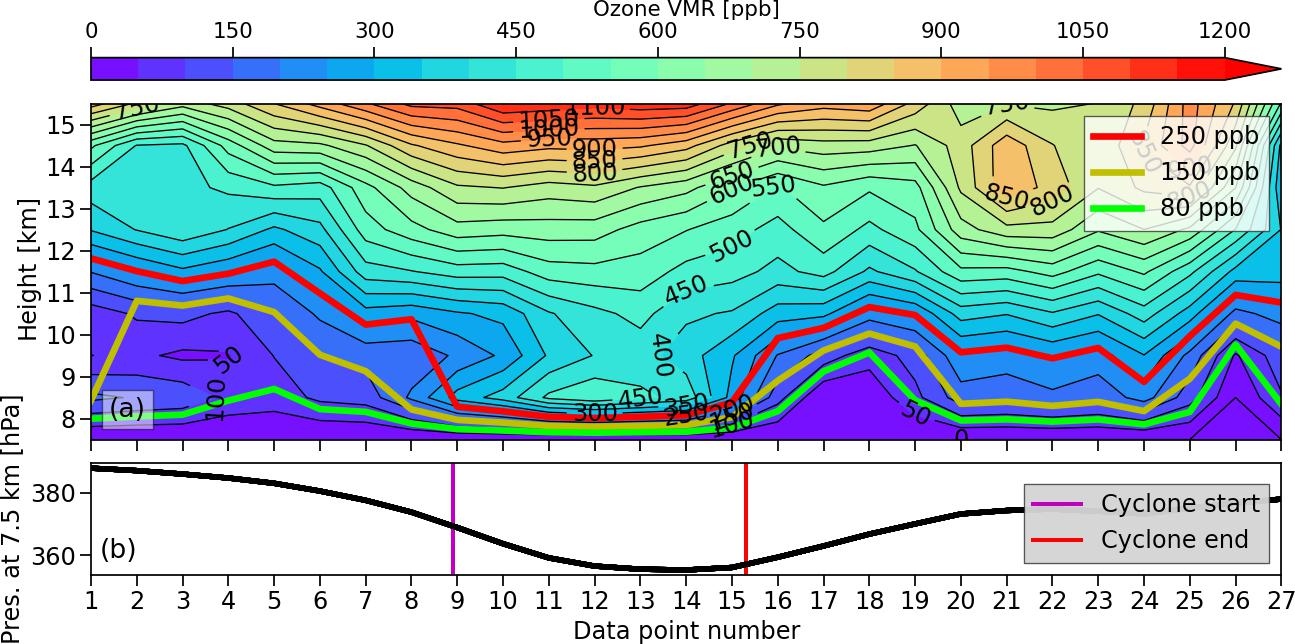
Variations in lower stratospheric ozone (10-20 km altitude) are linked to tropospheric weather phenomena, as shown as an example in this figure. Here, ozone is enhanced near 10 km altitude (top panel) above a middle tropospheric cyclone (7.5 km altitude, lower panel). In a study by Monsees et al. (2024), the impact of tropospheric cyclones on lower stratospheric ozone from limb satellite measurements, here OMPS-LP, was investigated. Since meteorological data needed as input to numerical weather forecasts are quite sparse in the Arctic region, the potential of using lower stratospheric ozone for assimilation in weather models may be relevant for improving weather forecasts in this region.
The top panel shows in colour OMPS-LP ozone as a function of the satellite orbit position (data point number) and altitude. The coloured lines represent levels of constant ozone amounts of 80, 150, and 250 ppb, respectively. The lowering in altitude of these lines, in particular 250 ppb, correlates well with the drop in air pressure inside the cyclone and can be used as a proxy for tropospheric cyclone activity.
Reference: Monsees, F., Rozanov, A., Burrows, J. P., Weber, M., Rinke, A., Jaiser, R., and von der Gathen, P.: Relations between cyclones and ozone changes in the Arctic using data from satellite instruments and the MOSAiC ship campaign, Atmos. Chem. Phys., 24, 9085–9099, https://doi.org/10.5194/acp-24-9085-2024, 2024.
April 2025:
To estimate the future impacts of climate change, we rely on climate projections generated by Earth System Models (ESMs). Radiation plays a crucial role in driving the climate system and is among the most computationally intensive components of ESMs. To save computing resources, radiation calculations are often performed less frequently or with lower detail, which introduces uncertainties in how clouds and radiation interact.
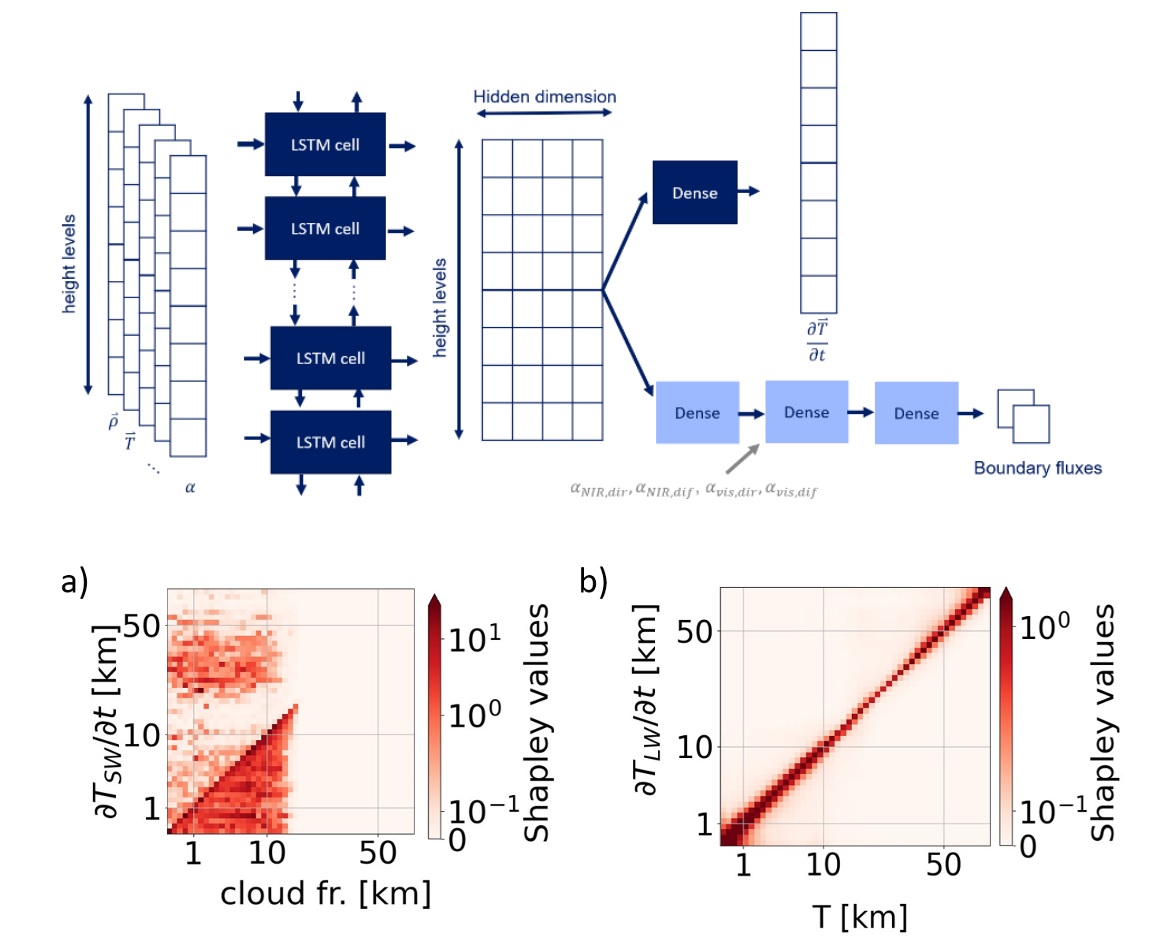
Here, we develop a machine learning (ML) model to accelerate radiation calculations while maintaining accuracy. Specifically, we use a Bidirectional Long Short-Term Memory (Bi-LSTM) that scans the vertical profile of each column in the model in upward and downward direction. This should mimic the upward and downward fluxes computed in the radiation parameterization used in a well-known climate model, the ICOsahedral Non-hydrostatic (ICON) model. Our ML-based model reliably predicts heating rates for both sunlight (shortwave radiation) and heat from Earth and atmosphere (longwave radiation). We analyze the predictions of the ML-based emulator and demonstrate that it successfully captures underlying physical relationships. We find that the ML-model learns that clouds play a crucial role. Figure a) shows that if we have a cloud at height of e.g. 10 km then this has a strong effect on the shortwave temperature tendency on the same height and also on every level below because the cloud is absorbing and reflecting the incoming sunlight which leads to less heating below the cloud.
But the reflected radiation can also lead to heating in the stratosphere. For longwave radiation, the ML-model correctly identified that the temperature is locally important but also affects neighboring cells which indicated by the diffuse diagonal line in Figure b). This is physically correct as the atmosphere itself is a source of longwave radiation and the strength is defined by the temperature.
Katharina Hafner, Fernando Iglesias-Suarez, Sara Shamekh, et al. Interpretable Machine Learning-based Radiation Emulation for ICON. ESS Open Archive . November 15, 2024.
DOI: 10.22541/essoar.173169996.65100750/v1
https://essopenarchive.org/users/856312/articles/1240793-interpretable-machine-learning-based-radiation-emulation-for-icon
March 2025:
Lara Aschenbeck and Oliver Huhn from the Institute of Environmental Physics (IUP), Oceanography Department, taking samples on board of the research icebreaker Polarstern in the Weddell Sea. On the Polarstern expedition PS146 (HAFOS/COSMUS-2), the two are taking seawater samples for the anthropogenic trace gases CFCs and SF6 as well as the noble gases helium and neon, which will later be measured and evaluated at the IUP.
The CFC and SF6 measurements provide information on the time scales of ocean transport and the uptake of anthropogenic carbon, while the noble gases enable the calculation of the contributions of melted glaciers. Photo: Martin Losch.
February 2025:
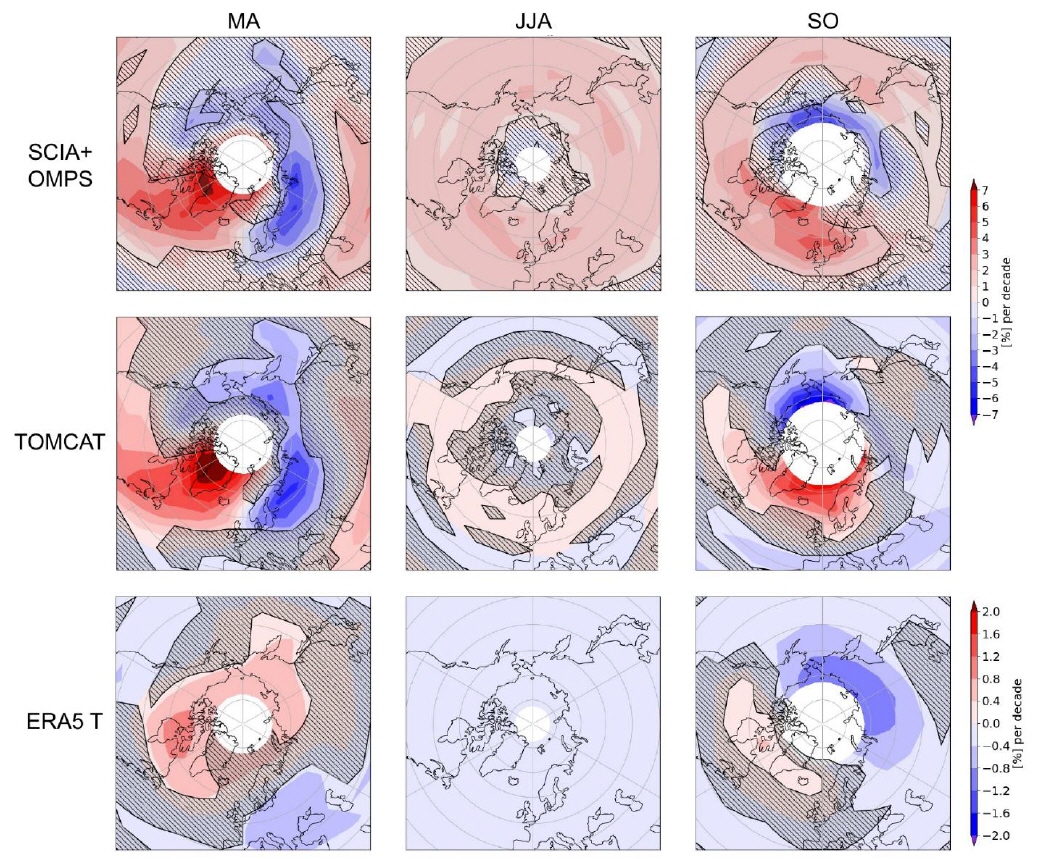
Asymmetries in ozone trends at northern high latitudes were investigated over the 2004-2022 period by using satellite limb observations (the merged SCIA+OMPS data set produced in IUP) and the TOMCAT chemistry transport model (in collaboration with the University of Leeds). This figure shows seasonal ozone trends for SCIA+OMPS (top row) and for a full-chemistry TOMCAT simulation (bottom row) at 32 km altitude for spring (MA), summer (JJA) and autumn (SO). During summer, the trend fields are fairly homogeneous over longitude, displaying significant positive values of about 1% per decade for SCIA+OMPS and close to zero for TOMCAT. In contrast, during spring and fall an asymmetric patter is detected.
The strong zonal asymmetry in the spring‐time trends in SCIA+OMPS is captured very well by TOMCAT, with the positive maximum located over the North Atlantic sector. The negative values between Scandinavia and Siberia are also statistically significant (at 2σlevel) for both observations and model. A similar bi‐polar pattern is also found in SO, but more confined to polar latitudes and shifted in longitude. This pattern was further analyzed in connection with the polar vortex position and with trends in potential vorticity in the middle stratosphere. We found that changes in the mean polar vortex position and strength are linked to this ozone trend asymmetry. The overall pattern underwent decadal changes over the last 40 years, with the most recent two decades seeing a probable strengthening of the vortex and a shift toward North America.
Reference
Arosio, C., Chipperfield, M. P., Rozanov, A., Weber, M., Dhomse, S., Feng, W., ... & Burrows, J. P. (2024). Investigating zonal asymmetries in stratospheric ozone trends from satellite limb observations and a chemical transport model. Journal of Geophysical Research: Atmospheres, 129(8), e2023JD040353.
December 2024:
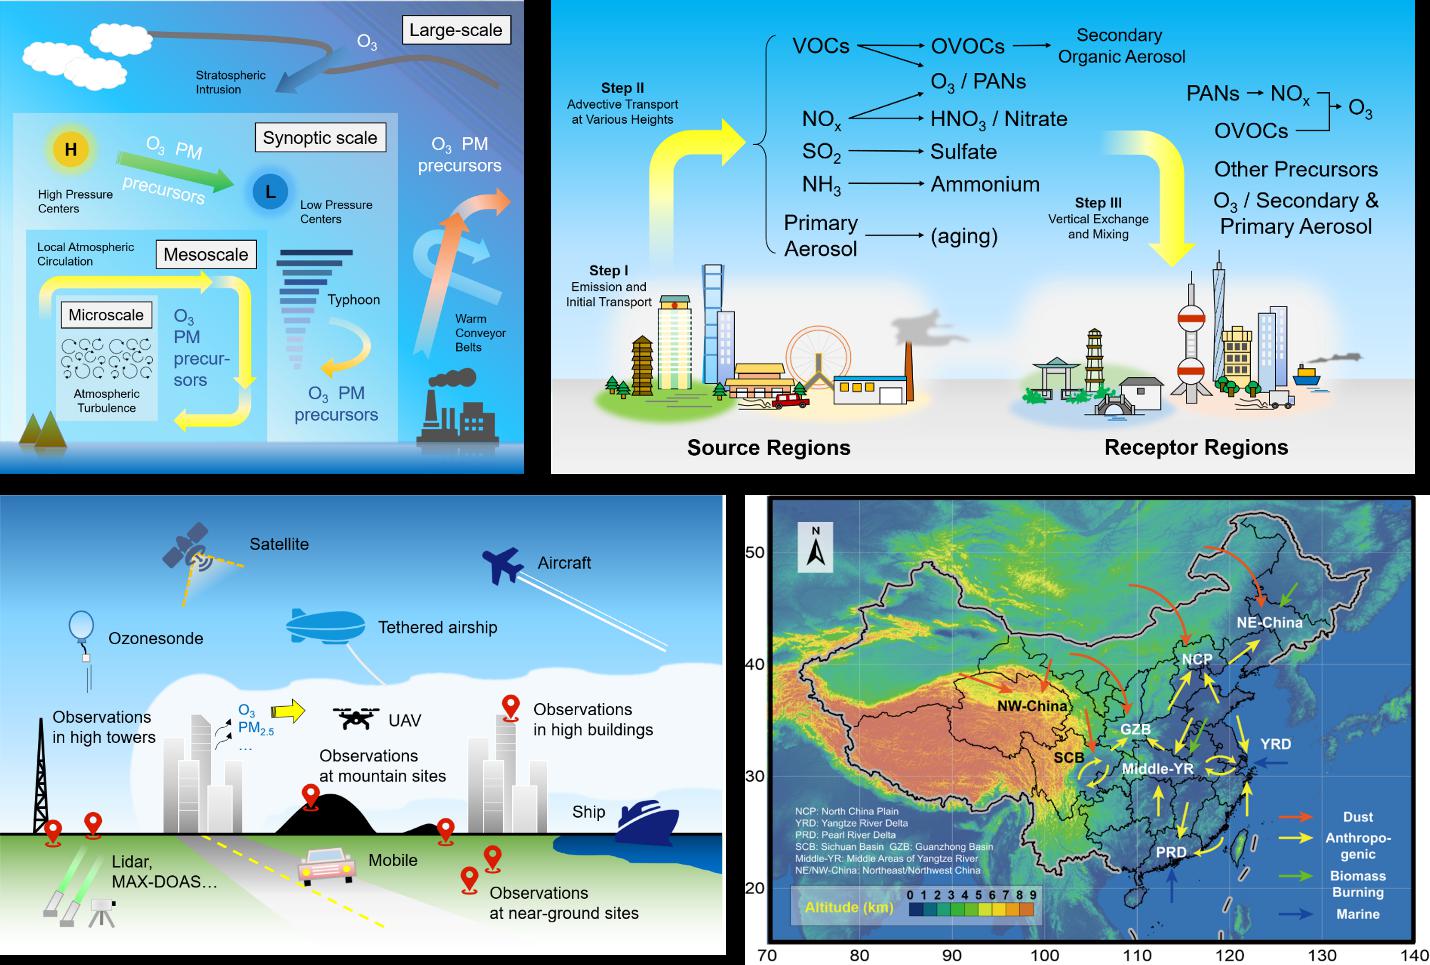
The complex influence of cross-regional transport on ozone and particulate matter pollution and relative results in China
Cross-regional transport (CRT) refers to the long-range movement of pollutants over distances ranging from tens to thousands of kilometers, crossing regional boundaries and contributing to air pollution in downwind areas. CRT is inherently complex, driven by dynamic mechanisms operating across multiple scales and accompanied by chemical transformations occurring during transport.
This study specifically examines the influence of CRT on ozone and particulate matter pollution in China, a country facing significant air quality challenges. Ozone and particulate matter are the focus of this analysis due to their moderately long lifetimes, which make them particularly susceptible to CRT. In this review (Qu et al., 2024), recent findings and methodologies are summarized, with an emphasis on the use of in situ and remote sensing observations, as well as modeling approaches, to quantify CRT contributions and explore the detailed processes involved.
Our analysis reveals that China’s major urban clusters have been, overall, more influenced by CRT than by local emissions. Additionally, the study identifies key transport pathways and the critical dynamic and chemical processes shaping air pollution across various regions of the country (Fig. 1).
Acknowledgement:
This work is supported by the National Key Research and Development Program of China, the Deutsche Forschungsgemeinschaft (DFG, German Research Foundation) under Germany´s Excellence Strategy and the co-funded DFG-NSFC Sino-German Air-Changes project (448720203).
Reference:
Qu, K., Yan, Y., Wang, X., Jin, X., Vrekoussis, M., Kanakidou, M., Brasseur, G.P., Lin, T., Xiao, T., Cai, X., Zeng, L., and Zhang, Y.: The effect of cross-regional transport on ozone and particulate matter pollution in China: A review of methodology and current knowledge, Sci. Total Environ., 947, 174196, https://doi.org/10.1016/j.scitotenv.2024.174196, 2024. Contact: Kun Qu (qukun@uni-bremen.de)
November 2024:
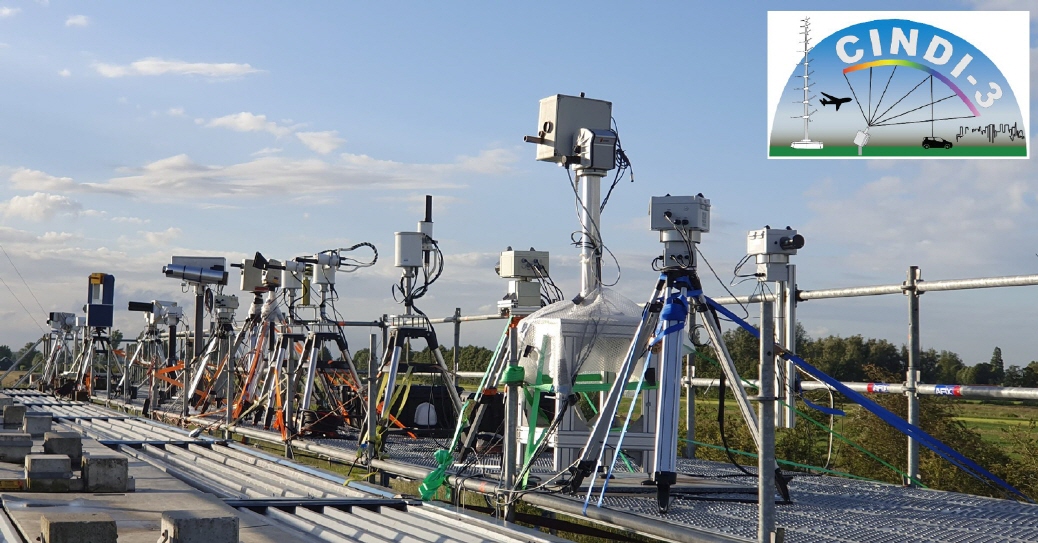
In May and June 2024, the third Cabauw INtercomparison of UV-Vis DOAS Instruments (CINDI-3) campaign took place in Cabauw, the Netherlands. More than 40 Differential Optical Absorption Spectroscopy (DOAS) instruments of research groups from all over the world came together to take measurements of nitrogen dioxide (NO2) and many other trace gases. Organised as a semi-blind intercomparison, one of the campaign's aims was to establish the consistency and accuracy of these measurements, which are often used to validate satellite observations.
As a secondary objective, the exchange of information, know-how and even code between groups was encouraged and facilitated by daily meetings and the creation of several task groups working on improvements of specific retrieval aspects such as vertical profiling, glyoxal fits or aerosol retrievals.
The DOAS group of the University of Bremen participated in the campaign with several instruments, including its standard 2d MAX-DOAS instrument, the IMPACT imaging spectrometer, and a mobile DOAS operated from a car. The latter was part of a coordinated effort to characterise the NO2distribution around the campaign location with several vehicles, balloons and aircraft overpasses. Results from the semi-blind comparison and the different task groups will be published in the coming years.
October 2024:
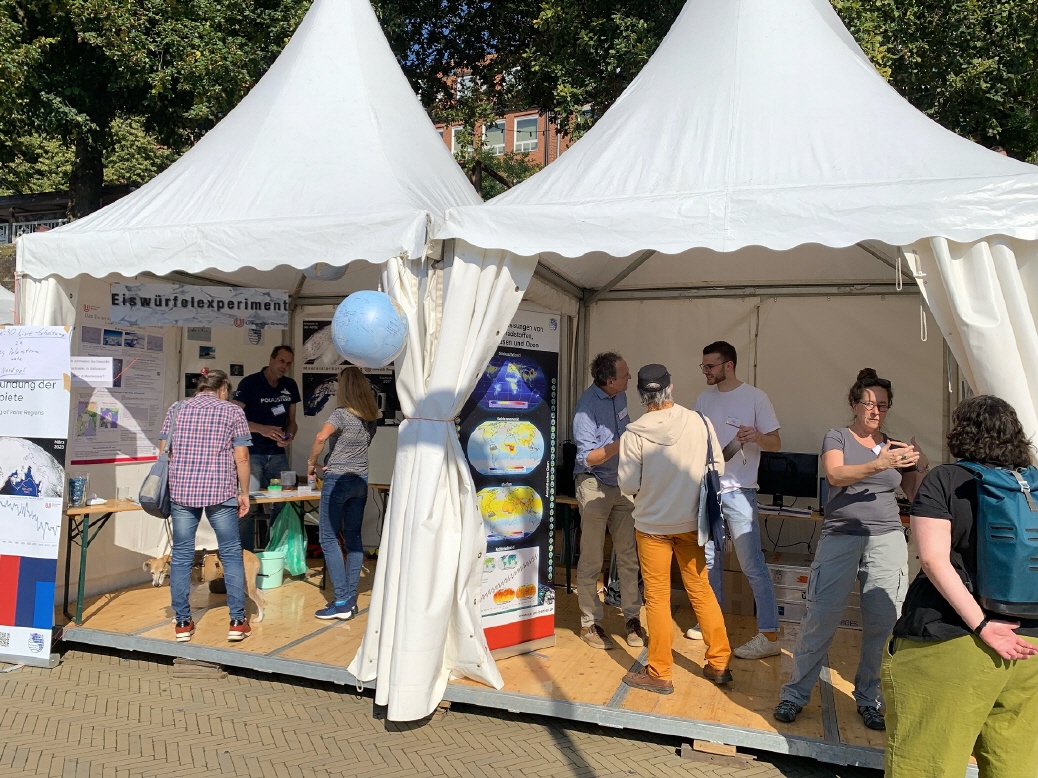
On 21 and 22 September 2024 the ‘Forschungsmeile’ during the ‘Maritime Woche 2024’ took place in Bremen. IUP groups from the areas remote sensing, physics and chemistry of the atmosphere and oceanography presented their research to the public and had interesting discussions with the visitors. One highlight of the event was a live connection to the research vessel ‘Polarstern’ in the Arctic.
Contact: Stefan Noël (stefan.noel@iup.physik.uni-bremen.de)
September 2024:
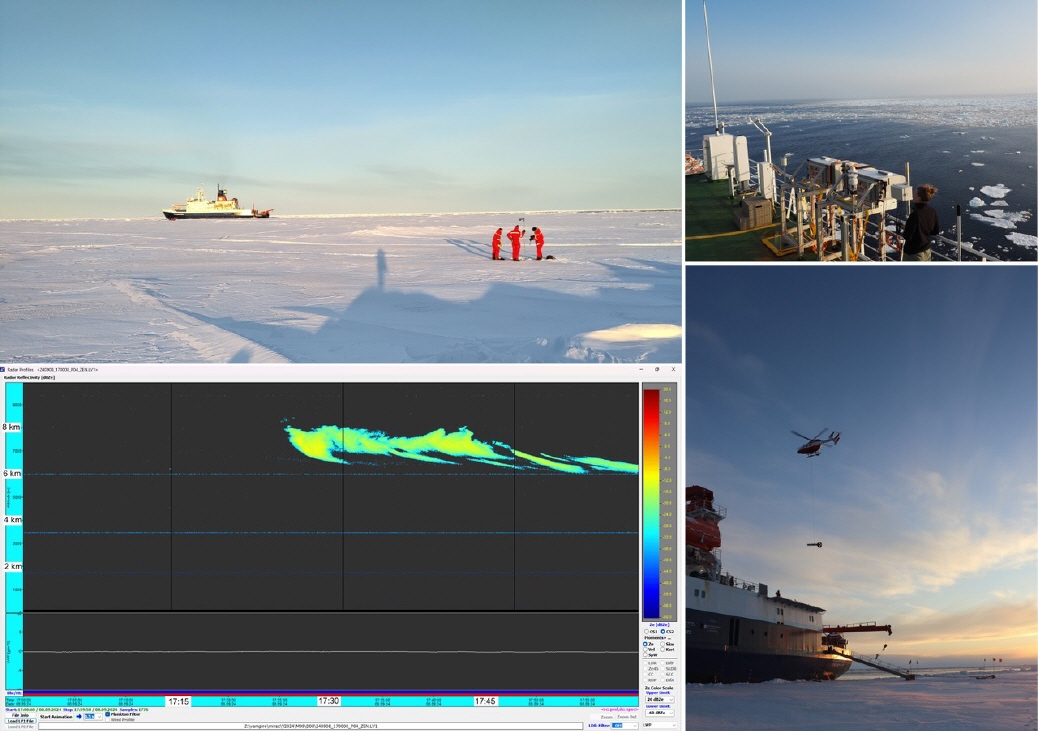
Together with the University of Cologne and AWI the IUP currently is participating in the RV Polarstern cruise PS144 ArcWatch2. From onboard the ship we are measuring atmosphere and sea ice properties with microwave radiometers and radars (upper right) to improve numerical weather prediction and satellite observations. During ice stations (upper left) the physical properties of the sea ice and snow are measured in detail: for example, the size of snow grains, ice thickness, salinity, and temperature. This information is needed to interpret the microwave measurements on the ship and also from satellites. During the ice station, the upward-looking cloud radar observed cirrus clouds (lower left), which you can also see in the lower right and upper left photos. To also observe the sea ice thickness on a larger scale, helicopter flights are conducted with an instrument called EM-bird, hanging below the helicopter (lower right photo). Find more information under https://follow-polarstern.awi.de and https://blog.uni-koeln.de/awares/ (photo credits Janna Rückert and Linnea Bühler).
August 2024:
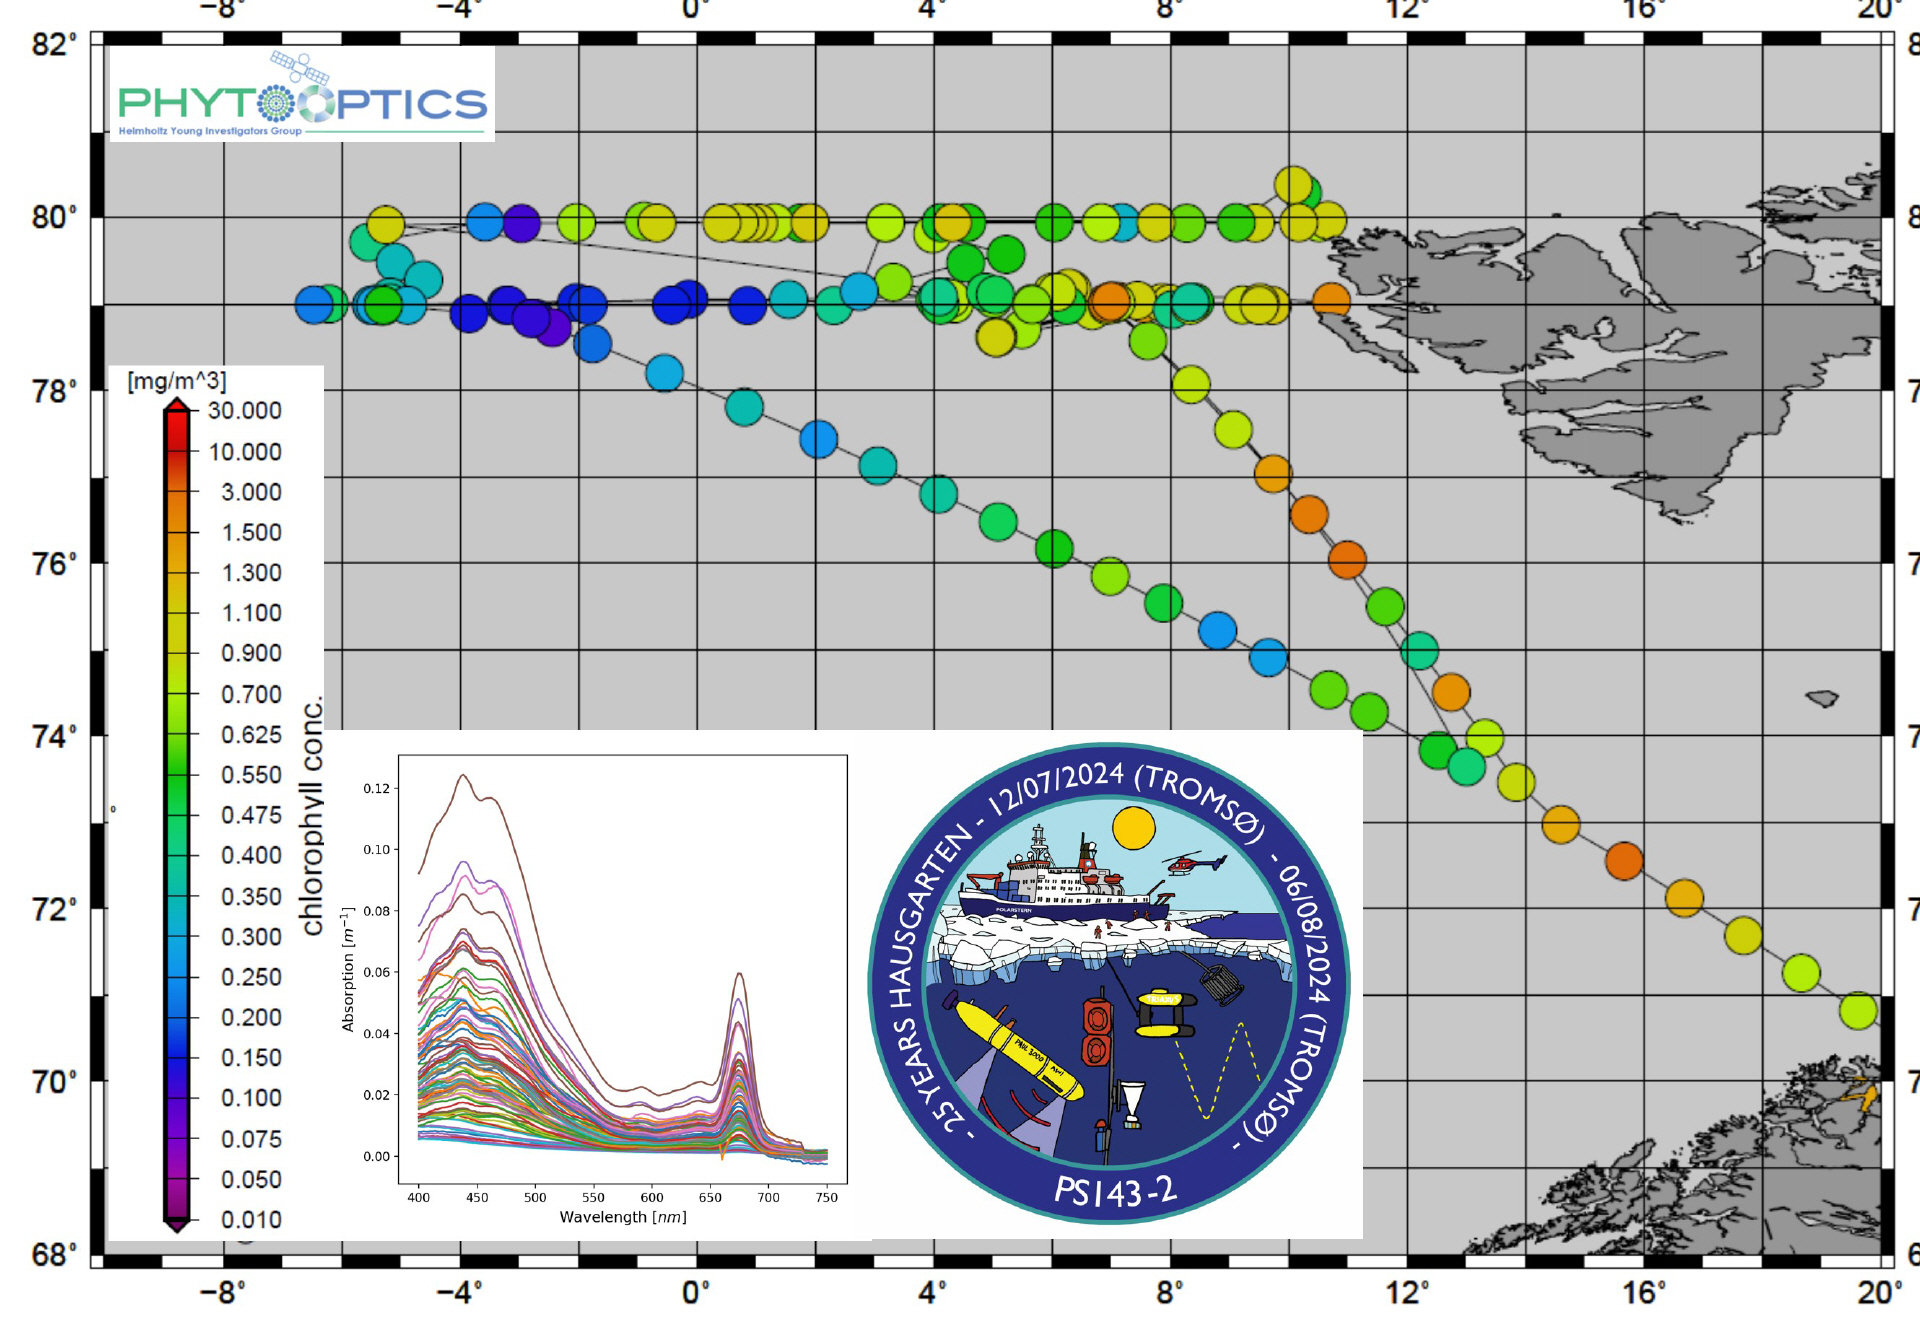
The AWI-IUP Phytooptics-Group participated in the RV Polarstern expedition PS143-2 in Fram Strait (East Greenland Sea) from 12 July to 5 August 2024 where the biodiversity and biogeochemistry of ocean surface water was studied in comparison to ocean physical properties.
From optical measurements the Phytooptics-Group determined the spectral absorption of under water light by particles in general and phytoplankton specifically. First results are shown from measurements on water samples measured with the quantitative filtration technique using an integrative cavity absorption measurement system (details in Liu et al. 2018: https://doi.org/10.1364/OE.26.00A678)
The absorption properties are used to determine from the spectral shape and strength of the absorption the composition of the phytoplankton, but here the overall biomass (chlorophyll concentration) from the peak height around 667 nm is presented but also. While the eastern part shows higher concentrations which is associated to the Atlantic water, the western part shows very low chlorophyll concentration. Overall the biomass is no very high, indicating rather post algal bloom conditions.
Figure from Astrid Bracher (bracher@uni-bremen.de).
July 2024:
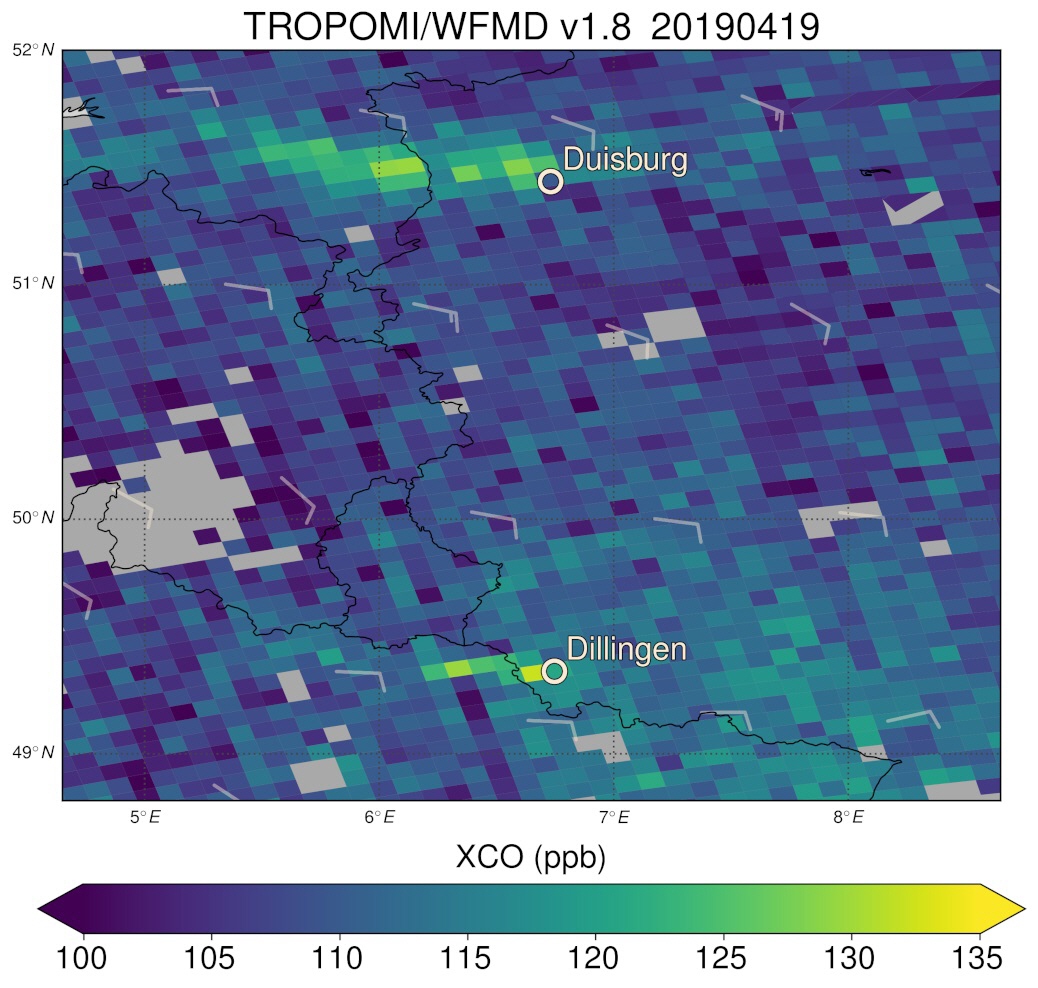
Conventional steel production is a major contributor to global industrial CO2 emissions due to its reliance on carbon-rich materials. To meet climate targets, the systematic decarbonisation of the steel industry is essential, with one key approach being the transition to hydrogen-based production, which produces water vapour instead of CO2. Another by-product of the conventional steelmaking process is carbon monoxide (CO), which can be better monitored with satellite sensors from space than the greenhouse gas CO2 itself. Consequently, co-emitted CO may serve as a valuable indicator of the carbon footprint of steel plants.
The figure shows an example of CO plumes from the two most productive steel production sites in Germany detected by a single overpass of the TROPOspheric Monitoring Instrument (TROPOMI) on board the Sentinel-5 Precursor satellite. By systematically analysing the satellite data over the long term, the CO emissions of all German integrated steelworks can be determined (Schneising et al., 2024). If the estimated CO emissions of these steel production sites are related to the associated CO2 emissions reported by the steel manufacturers for the same period, there is a very high correlation between CO and CO2 emissions across all analysed sites. This linear relationship justifies using CO as a proxy for CO2 emissions from comparable steel production sites, i.e. the greenhouse gas emissions of modern conventional steel plants can be specifically derived from space using the corresponding estimated CO emissions and the CO/CO2 emission ratio calibrated to German steelworks.
Reference
Schneising, O., Buchwitz, M., Reuter, M., Weimer, M., Bovensmann, H., Burrows, J. P., and Bösch, H.: Towards a sector-specific CO∕CO2 emission ratio: satellite-based observations of CO release from steel production in Germany, Atmos. Chem. Phys., 24, 7609–7621, https://doi.org/10.5194/acp-24-7609-2024, 2024.
June 2024:
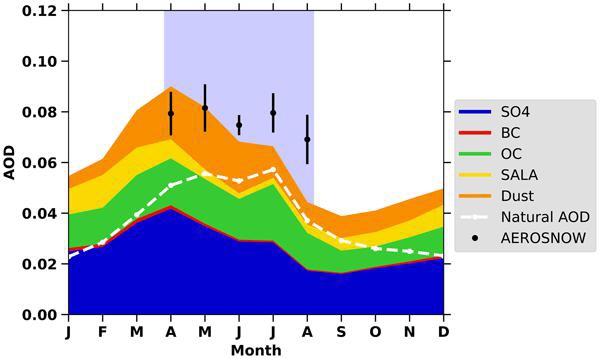
Aerosols are small suspended liquid or solid particles in the terrestrial atmosphere. A recent study conducted by the IUP group "Cloud Aerosol Surface PArameter Retrieval" in the framework of the transregional project (AC)⊃3; investigated the spatial and temporal distribution of aerosols in the Arctic.
Arctic aerosols are important drivers of the Arctic climate due to their ability to act as cloud condensation nuclei or ice nucleating particles. As a consequence of their poorly known distribution and physico-chemical characterization, Arctic clouds, which in turn are strong Arctic climate agents, are also poorly understood.
The image shows the Aerosol Optical Depth (AOD), a parameter describing the total atmospheric aerosol load. The AOD is derived from satellite observations and modeled by GEOS-Chem, a chemical transport model. The satellite observations are based on a novel algorithm which has been developed and quality-assessed by the group. On the other hand, the model results, reflect state-of-the-art understanding of aerosol processes in the Arctic. Relating satellite based observations and model will therefore tell us how much of our (model) understanding is confirmed by the observations or not.
The seasonal AOD over the central Arctic cryosphere is averaged over the period 2003-2011. The stacked plot shows the GEOS-Chem model and the black dots the mean AOD derived from satellite data. Obviously the model results are different from the satellite data in summer. This indicates weaknesses of the model with respect to the distribution and characterization of aerosols during Arctic summer. This in turn can lead to significant problems in the characterization of Arctic clouds. Further investigations are in progress.
Reference: Swain, B., Vountas, M., Singh, A., Anchan, N. L., Deroubaix, A., Lelli, L., Ziegler, Y., Gunthe, S. S., Bösch, H., and Burrows, J. P.: Aerosols in the central Arctic cryosphere: satellite and model integrated insights during Arctic spring and summer, Atmos. Chem. Phys., 24, 5671–5693, https://doi.org/10.5194/acp-24-5671-2024, 2024.
Kontakt/contact: Marco Vountas: vountas@iup.physik.uni-bremen.de
https://www.iup.uni-bremen.de/aerosol
May 2024:
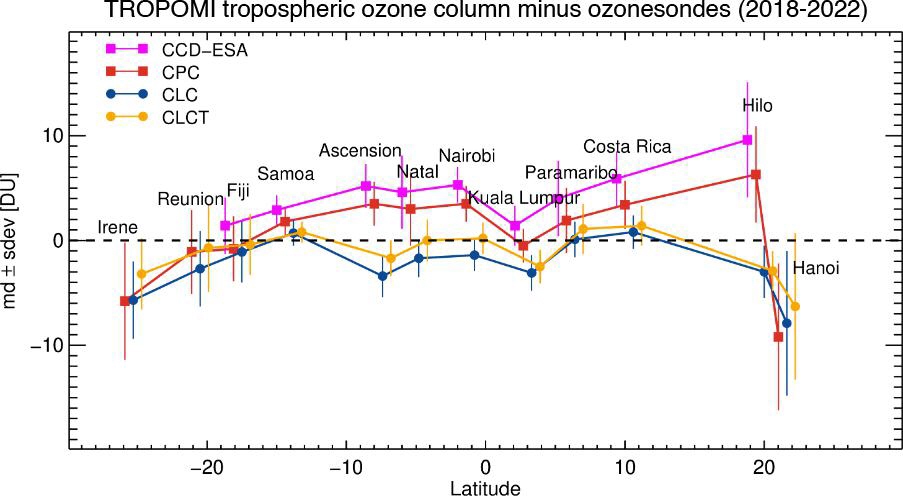
The latitudinal variation of the mean difference (md) and standard deviation (sdev) between TROPOMI tropospheric ozone column retrieved using the four algorithms, ESA (European Space Agency, magenta) and our CPC (red), CLC (blue), and CLCT (yellow) retrievals, and collocated ozone sonde columns during the time period from 2018 to 2022. All TROPOMI algorithms use the convective-cloud-differential (CCD) method that subtracts from the clear-sky total ozone column the column amount above high convective clouds (above-cloud-column-ozone, ACCO) to obtain tropospheric ozone column amounts (TrOC). ESA and CPC use ACCO only from the Pacific region to obtain TrOC over the entire tropical region, while the advanced algorithms CLC and CLCT use ACCO from nearby clouds (local cloud algorithm). The latter two algorithms lead to a better agreement of TROPOMI tropospheric ozone with collocated ozone sondes and make this algorithm also more suitable for application in the subtropics and extratropics (e.g. middle latitudes). Tropospheric ozone is a potent greenhouse gas and a pollutant, harmful to our ecosystem. Global measurements of tropospheric ozone are only available from satellite instruments like TROPOMI.
Reference: Maratt Satheesan, S., Eichmann, K.-U., Burrows, J. P., Weber, M., Stauffer, R., Thompson, A. M., and Kollonige, D.: Improved CCD tropospheric ozone from S5P TROPOMI satellite data using local cloud fields, EGUsphere [preprint], https://doi.org/10.5194/egusphere-2023-2825, 2024.
April 2024:
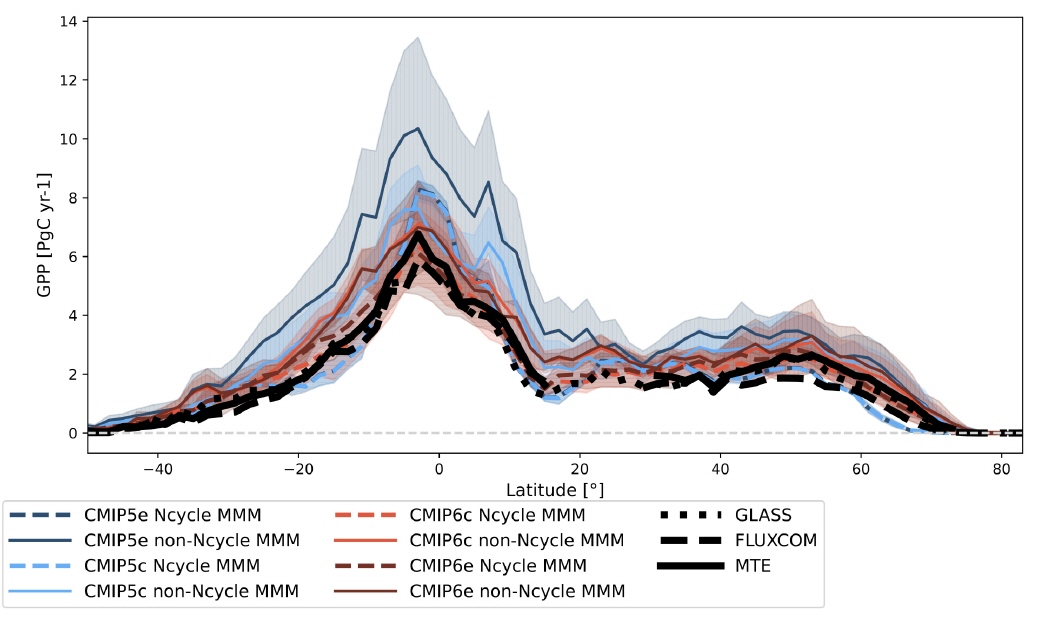
Our figure of the month shows the gross primary production (GPP) from Coupled Model Intercomparison Project Phase 6 (CMIP6; red; Eyring et al., 2016) and CMIP5 (blue) models with (dashed) and without (solid) interactive nitrogen cycle (Ncycle) compared to reference data sets based on measurements of the FLUXNET eddy covariance tower network: a data set upscaled with the model tree ensembles (MTE) approach and FLUXCOM data, which additionally incorporate Moderate Resolution Imaging Spectroradiometer (MODIS) as well as meteorological data using various machine learning methods. Furthermore, both simulations with prescribed CO2emissions (e, darker colors) and prescribed concentrations (c, lighter colors) are used. GPP represents the CO2 uptake on land due to photosynthesis. This was one of the biggest weaknesses of the CMIP5 ensemble, with most models overestimating photosynthesis. In the figure, this can be seen by the large overestimation of non-Ncycle CMIP5 compared to the reference data sets. The CMIP6 non-Ncycle MMMs show a much better approximation across all latitudes, with a slight reduction of the bias in the NH but a significant overestimation in the tropics. The CMIP6 Ncycle models show a very good agreement with the reference data across all latitudes, now with slight underestimations at high latitudes.
This figure is part of Gier et al (2024), which investigates carbon cycle variables in CMIP6 and CMIP5 simulations and is currently under discussion for Biogeosciences. Gier et al. (2024) concludes, that there is a significant improvement in the simulation of photosynthesis in models with nitrogen cycle, as well as only small differences between emission and concentration-based simulations. Thus, it recommends to use emission driven simulations in the upcoming CMIP7 simulations as default setup as well as to view the nitrogen cycle as a necessary part of all future carbon cycle models.
The study was supported by the Climate-Carbon Interactions in the Current Century (4C) project, which is funded by the EU under the Horizon 2020 program. The figure was made using the Earth System Model Evaluation Tool v2 (ESMValTool; Eyring et al., 2020). ESMValTool includes many diagnostics to use with CMIP models and observations, as well as common preprocessor functions, such as the computation of multi-model means, area averages, and the derivation of custom variables, which were used for this work.
Related projects:
Climate-Carbon Interactions in the Current Century (4C)
Coupled Model Intercomparison Project (CMIP)
REFERENCES
Eyring, V., Bony, S., Meehl, G. A., Senior, C. A., Stevens, B., Stouffer, R. J., and Taylor, K. E.: Overview of the Coupled Model Intercomparison Project Phase 6 (CMIP6) experimental design and organization, Geosci Model Dev, 9, 1937-1958, 10.5194/gmd-9-1937-2016, 2016.
Eyring, V., Bock, L., Lauer, A., Righi, M., Schlund, M., Andela, B., Arnone, E., Bellprat, O., Brötz, B., Caron, L. P., Carvalhais, N., Cionni, I., Cortesi, N., Crezee, B., Davin, E. L., Davini, P., Debeire, K., de Mora, L., Deser, C., Docquier, D., Earnshaw, P., Ehbrecht, C., Gier, B. K., Gonzalez-Reviriego, N., Goodman, P., Hagemann, S., Hardiman, S., Hassler, B., Hunter, A., Kadow, C., Kindermann, S., Koirala, S., Koldunov, N., Lejeune, Q., Lembo, V., Lovato, T., Lucarini, V., Massonnet, F., Müller, B., Pandde, A., Pérez-Zanón, N., Phillips, A., Predoi, V., Russell, J., Sellar, A., Serva, F., Stacke, T., Swaminathan, R., Torralba, V., Vegas-Regidor, J., von Hardenberg, J., Weigel, K., and Zimmermann, K.: Earth System Model Evaluation Tool (ESMValTool) v2.0 – an extended set of large-scale diagnostics for quasi-operational and comprehensive evaluation of Earth system models in CMIP, Geosci. Model Dev., 13, 3383-3438, 10.5194/gmd-13-3383-2020, 2020.
Gier, B. K., Schlund, M., Friedlingstein, P., Jones, C. D., Jones, C., Zaehle, S., and Eyring, V.: Representation of the Terrestrial Carbon Cycle in CMIP6, EGUsphere [preprint], https://doi.org/10.5194/egusphere-2024-277, 2024.
March 2024:
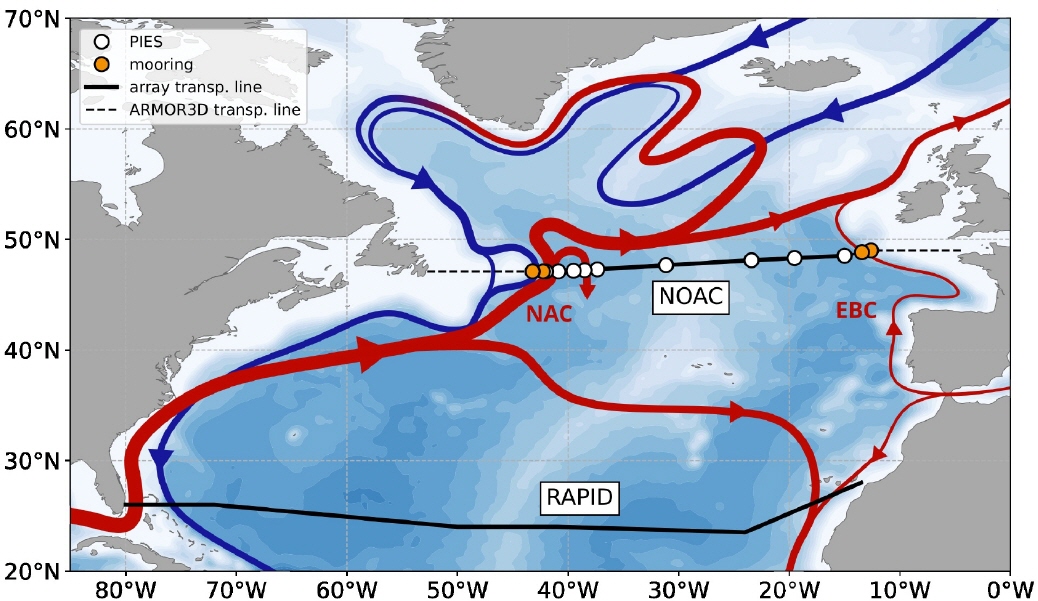
Since climate model studies project a decline of the Atlantic Meridional Overturning Circulation (AMOC) in the 21st century, monitoring AMOC changes remains essential. While AMOC variability is expected to be coherent across latitudes on longer than decadal timescales, connectivity on inter-annual and seasonal timescales is less clear. Model studies and observational estimates disagree on the regions and timescales of meridional connectivity and AMOC observations at multiple latitudes are needed to study its connectivity. We calculate basin-wide AMOC volume transports (1993-2018) from measurements of the North Atlantic Changes (NOAC) array at 47°N, combining data from moored instruments with hydrography and satellite altimetry. The mean NOAC AMOC is 17.2\,Sv exhibiting no long-term trend. Both the unfiltered and low-pass filtered NOAC AMOC show a significant correlation with the RAPID-MOCHA-WBTS AMOC at 26°N when the NOAC AMOC leads by about one year.
More information:
Wett, S., M. Rhein, D. Kieke, C. Mertens, und M. Moritz (2023), Meridional connectivity of a 25-year observational AMOC record at 47°N. Geophysical Research Letters, 50, e2023GL103284, doi:10.1029/2023GL103284.
February 2024:
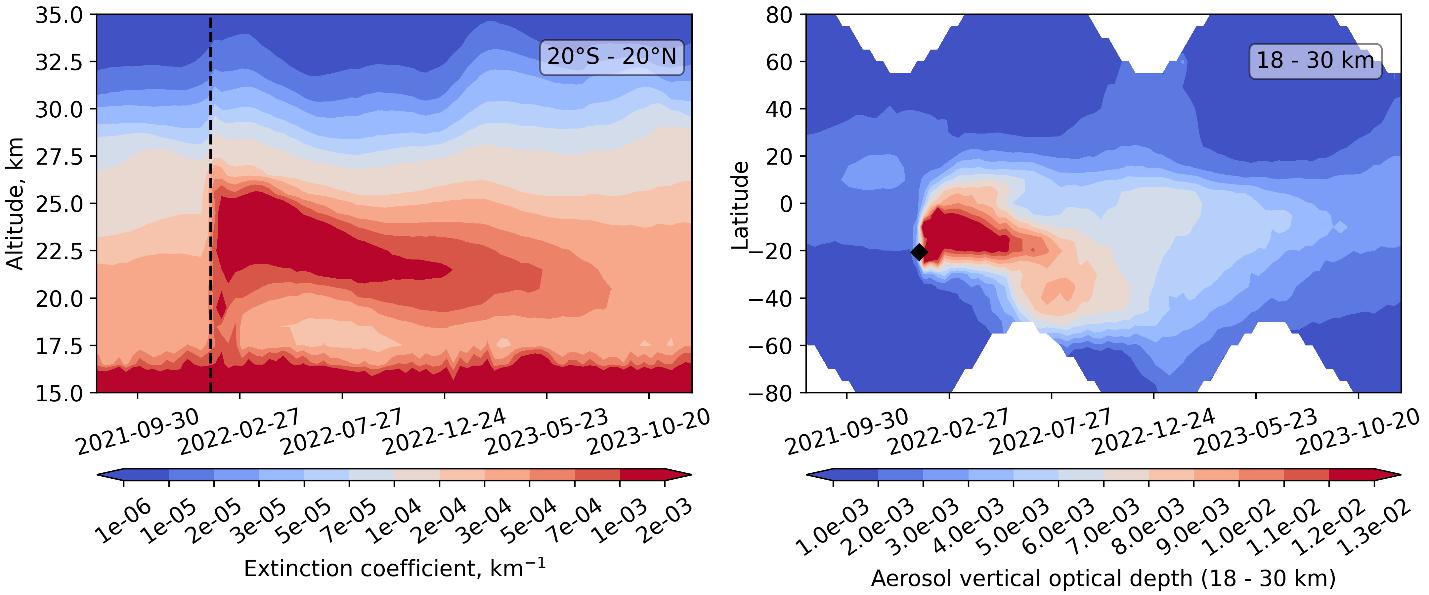
Vertical distributions of the stratospheric aerosol extinction coefficient were retrieved at the University of Bremen from measurements of scattered solar light in the limb viewing geometry made by the OMPS-LP instrument of NASA/NOAA. The obtained data enable us to investigate the evolution of the aerosol plume after the eruption of the Hunga Tonga–Hunga Haʻapai volcano in January 2022.
The left panel shows the zonal mean aerosol extinction coefficient distribution in tropics. The plume maximum reached the altitude of about 26 km and remained at these altitudes until the middle of May 2022. Thereafter, a rapid sinking of the plume maximum is observed. The right panel shows the vertical optical depth of the stratospheric aerosol (18 – 30 km). The plume mostly propagated to the southern hemisphere. Some transport events into the northern hemisphere are also seen, e.g. at the end of 2022. At the end of the analyzed record (December 2023), elevated values of the stratospheric aerosol optical depth are still observed in the tropics and southern mid-latitudes.