
Cavity enhanced spectroscopy
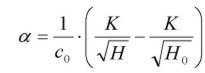
- This detection scheme uses a cavity to enhance the effect of small losses, as does Cavity ring-down spectroscopy (CRDS). Contrary to the latter method, here the absorption is calculated from the mirror-transmitted intensity. As in CRDS, the absorber of interest is placed in a high-finesse optical cavity bounded by two high reflective mirrors. The transmission signal strength H is measured with and without absorber and from the difference the absorption coefficient α and, if the absorber’s cross section is known, its concentration is deducted. The formula for the absorption coefficient α is comparable to the one for CRDS:
|
||||
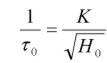
with c0 being the speed of light, H being the (normalized) transmission signal, and K being a system dependent proportionality factor. The latter is calculated by performing a ring-down time measurement of the “empty cell” (yielding τ0) and using the equation
|
||||
These equations are not true for any experimental setup, though. Generally, the cavity transmission strength H depends on many factors besides absorption, most of them related to the laser behavior (line width, stability, vertical mode structure). Only if the latter are eliminated the transmission is then directly convertible to absorption coefficients. This is why a variant of CEAS, the so-called Optical Feedback CEAS (OF-CEAS) method is used within our group.
The effect of optical feedback
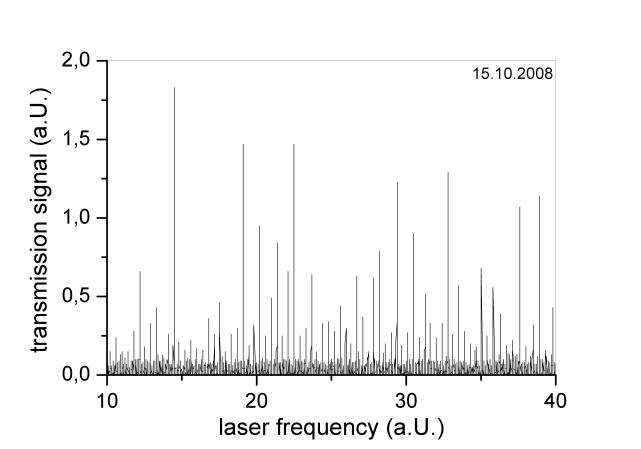
The figure below shows a transmission signal of a typical (slow) laser scan over several cavity resonances. It is evident that the resonances are quite different in terms of transmission strengths. This is mostly due to the fact that the laser line width is in the order of a few MHz, while a cavity resonance width is only a few kHz! Thus, depending on the circumstances, a strongly varying fraction of the laser power is coupled to the cavity, and the signal strength is more or less coincidental.
Cavity resonance optical feedback can be used to decrease the laser line width and thus increase and stabilize the cavity transmission. A simple set up is shown in the figure below. For this scheme to work, the laser must react in the proper way to the optical feedback (dark blue line). Diode lasers are well suited for this application; here, an external cavity diode laser at 409 nm wavelength is used.
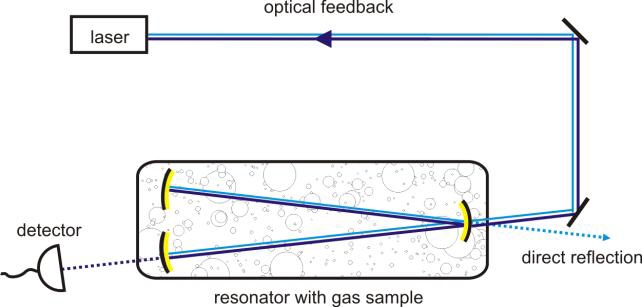
It is important to notice that the cavity has to consist of at least three mirrors since it must be avoided that the direct reflection of the first cavity mirror enters the laser. Here a so-called V-cavity is used, and the direct reflection of the first (folding) mirror is discarded. If now the laser frequency matches a cavity resonance and power build-up inside the cavity occurs, a small fraction of this power is transmitted through the folding mirror back to the laser (optical feedback).
This has very dramatic effects once the optical feedback strength is sufficient to force the laser line width to decrease.
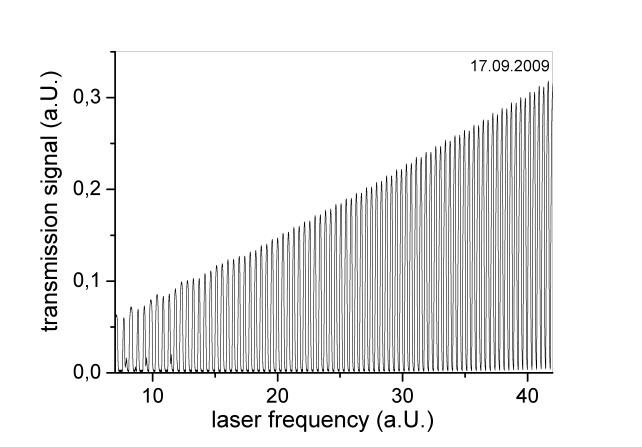
The transmission signals are stronger by several orders of magnitude (cannot be seen from the graphs) and are increasing linearly, which is due to the laser power getting stronger during the laser scan. This feature is eliminated by normalizing the transmission signal with the initial laser power measured before the cavity.
For further analysis the transmission maxima H0 are extracted from the transmission signals. Then, for all these maxima their corresponding ring-down time τ0 is measured to calculate the proportionality factor K. This factor is related to the detection setup, and as long as this remains stable, the factor K does not change. However, its value can be confirmed at any time by another ring-down time measurement.
If K is known for every transmission maximum, these can be directly converted to absorption coefficients using the above mentioned formula. The figure below shows a NO2 absorption spectrum measured with the OF-CEAS detector (black dots) and for comparison, two different measurements of Vandaele et al. (red rectangles) and Nizkorodov et al. (blue rectangles) – see below for further information. The absorption coefficient values match quite well, but the fine structure of the absorption does not match. This is due to the different measurement techniques used by Vandaele and Nizkorodov, which both have lower wavelength resolution than OF-CEAS (~1 pm vs. 0,2 pm), effectively smoothing the measured values. Also, errors of the absolute wavelength would shift and/or broaden/narrow the measured spectrum.
References
- This paper is the first demonstration of NO2 concentration measurements by OF-CEAS:
- I. Courtillot, J. Morville, V. Motto-Ros, and D. Romanini, Appl. Phys. B, 85, 407 (2006).A.C. Vandaele, C. Hermans, S. Fally, M. Carleer, et al., J. Geophys. Res. 107 (D18, 4348, doi:10.1029/2001JD000971), ACH 3-1 - ACH 3-12 (2002).S.A. Nizkorodov, S.P. Sander, and L.R. Brown, J. Phys. Chem. A 108, 4864-4872 (2004).